Global Series Introduction
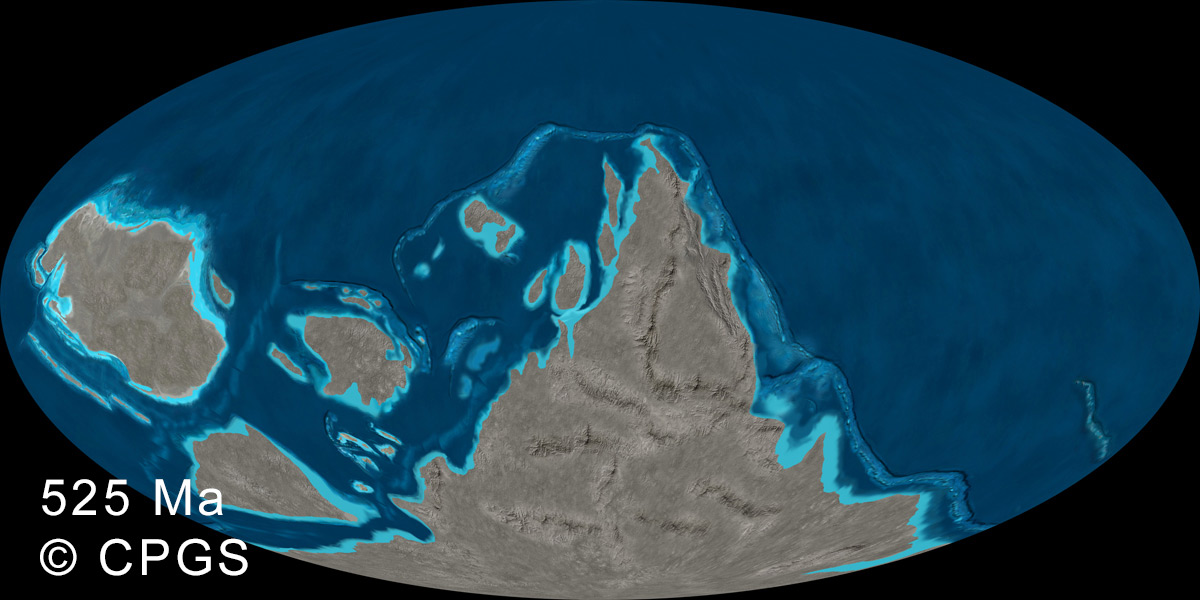
The “Global Deep Time Paleogeography ©2026” series was completed in 2026. Over the past ten years new plate models have appeared in the geologic literature and this new series uses these models to determine the position of continents and oceans through deep geologic time. Significant differences still exist in this recent literature, especially in pre-Devonian times (~ 400 Ma: Ma = mega annum; millions of years before present), so the maps presented in this series reflect compromise and extrapolation from various models. The maps represent how the Earth might have appeared through deep time – not exactly what it did look like (the latter goal is impossible). Because Earth paleogeography becomes increasingly controversial and difficult to decipher with increasing time, a maximum time slice of Lower Cambrian 525 Ma was selected.
The graphic data for the global paleogeography were plotted on a rectangular projection 8000 x 16000 pixels. The time slices are roughly 16 m. yrs. apart and therefore are averages of what the Earth may have looked like for the given time slice. This is especially true of paleo-shorelines that should be considered approximations; shorelines change much more rapidly than plate positions. A subtle change in plate position over 10 m.yrs. may have had 5-10 major changes of shoreline position. Therefore each of the time slices should be viewed as representing paleogeography over +/- 5 or 6 m.yrs. relative to the absolute age given on the time slice. Some of the early Paleozoic reconstructions likely have increased +/- values. The time scale used is from the “International Chronostratigraphic Chart – v. 2020” (http://www.stratigraphy.org)
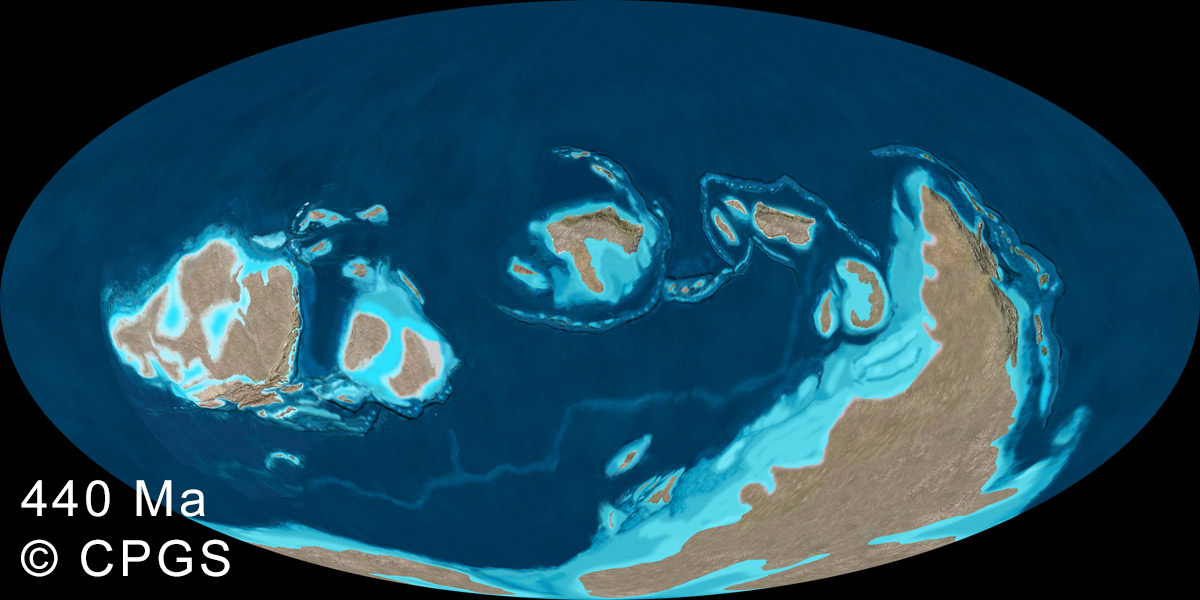
Maps are rasterized pixel images and are not shape files (nor are they based on shape files). Paleogeographic and paleotectonic elements (thrust belts, volcanic centers, paleo-shorelines, dune fields, basin geometry, facies maps, etc.) are plotted from the geologic literature and redrawn, repositioned, or reprojected on the base maps for the given time slices. This information is then used to construct the paleogeography. Paleogeography is cloned or painted using Photoshop®; cloned images are mostly from GeoMapApp, a marine geoscience, global topography data system (http://www.geomapapp.org/); cloned modern Earth DEM images from GeoMapApp are selected as modern analogues to the paleo-features they are chosen to represent; most DEM images have been re-colored, resized, and/or re-shaped in Photoshop® to fit the known or inferred geometry of the ancient features. Paleoclimate patterns, shown via hues of greens vs browns and tans, are generalized except for Lower Paleozoic maps that are uniformly drab (440 Ma and older) as these times reflect lack of significant land-based vegetation. Water depth is also generalized via shades of light blue for continental areas and darker blues for oceanic realms. Ocean trenches and mid-ocean spreading centers are shown as dark lines and lighter-colored ridges, respectively. Accuracy and detail of these features increases in Cenozoic rocks.
Global Paleogeography in Deep time ©2026
INDEX OF MAPS
Period/Epoch
Quaternary Maps
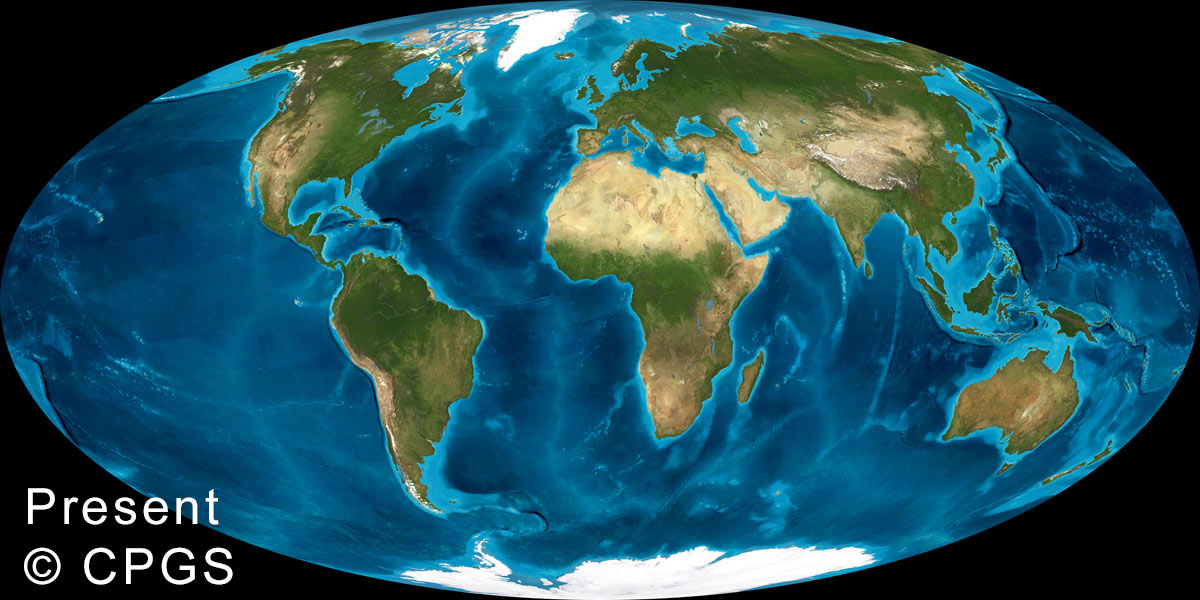
- 00 Ma Present
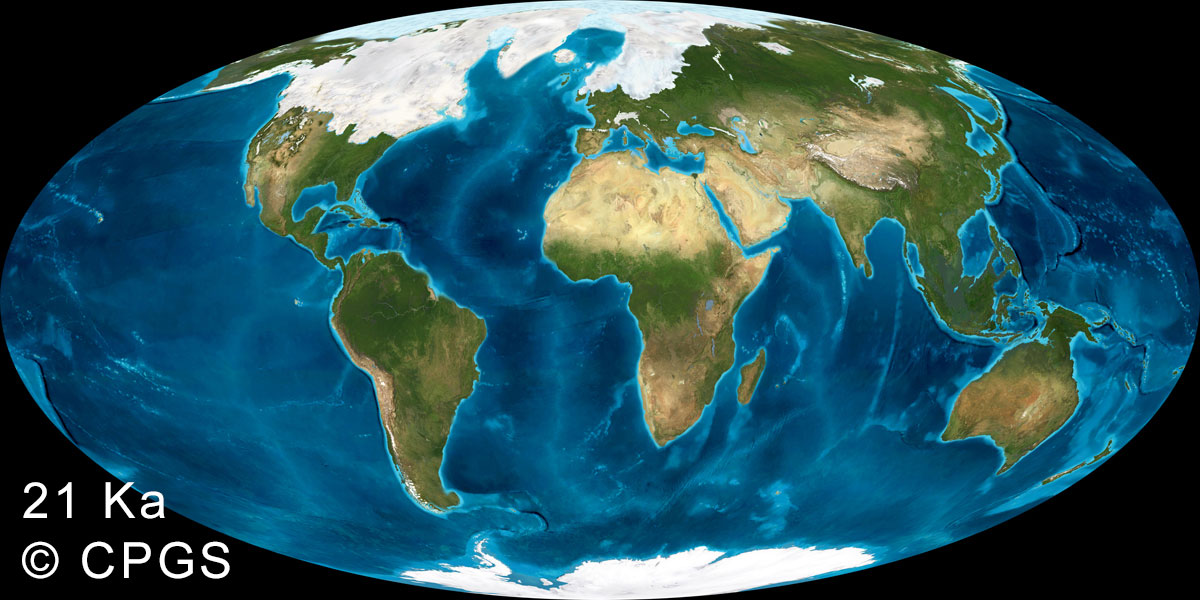
- 021 Ka Pleistocene_(GlacMax-Wisconsin)
Neogene Maps
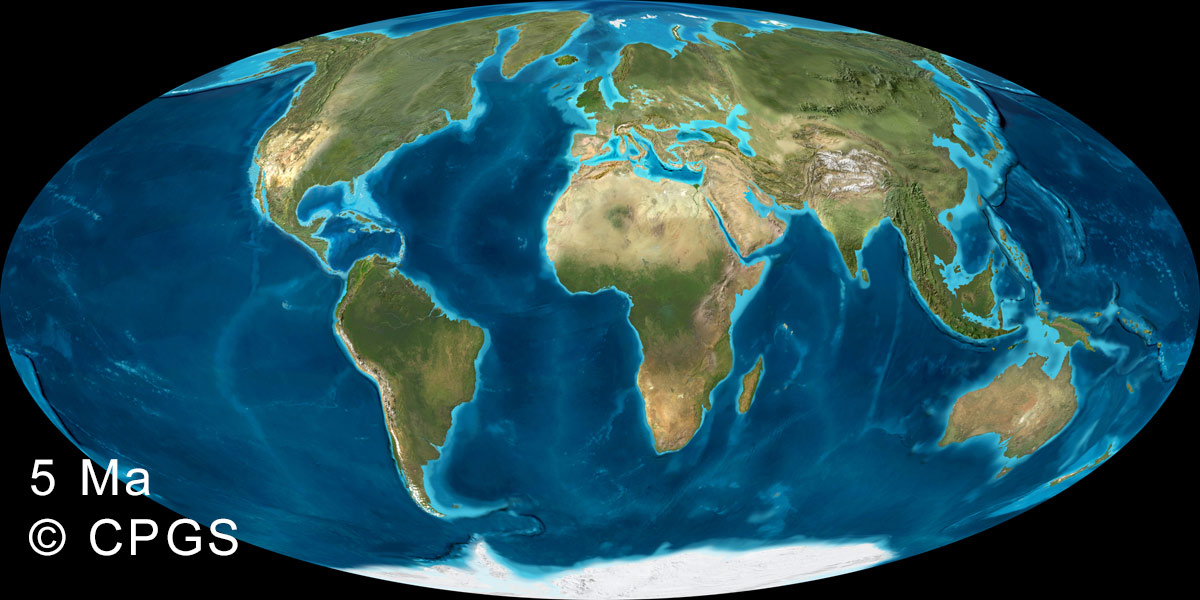
- 05 Ma Neogene-Pliocene
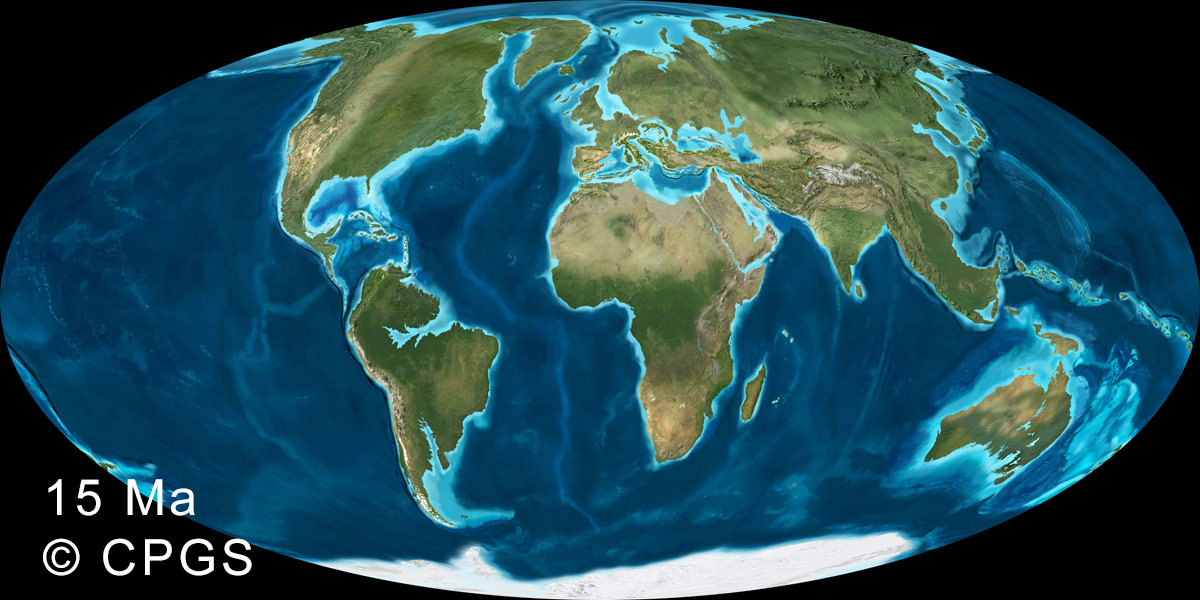
- 15 Ma Neogene-Miocene.psd
Paleogene Maps
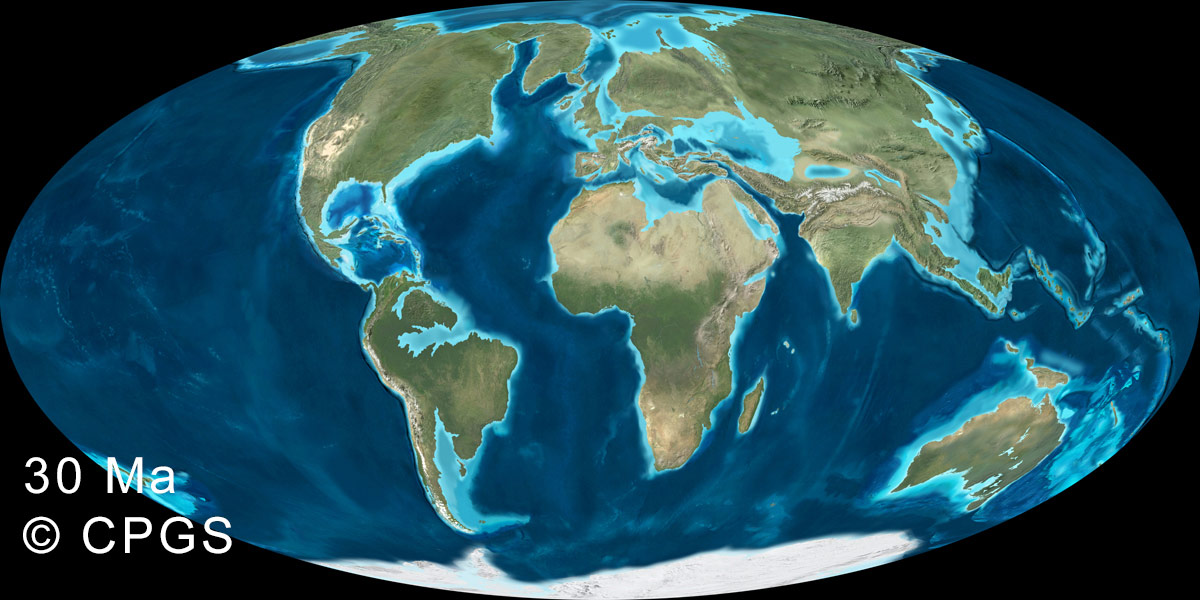
- 30 Ma Paleocene-Oligocene
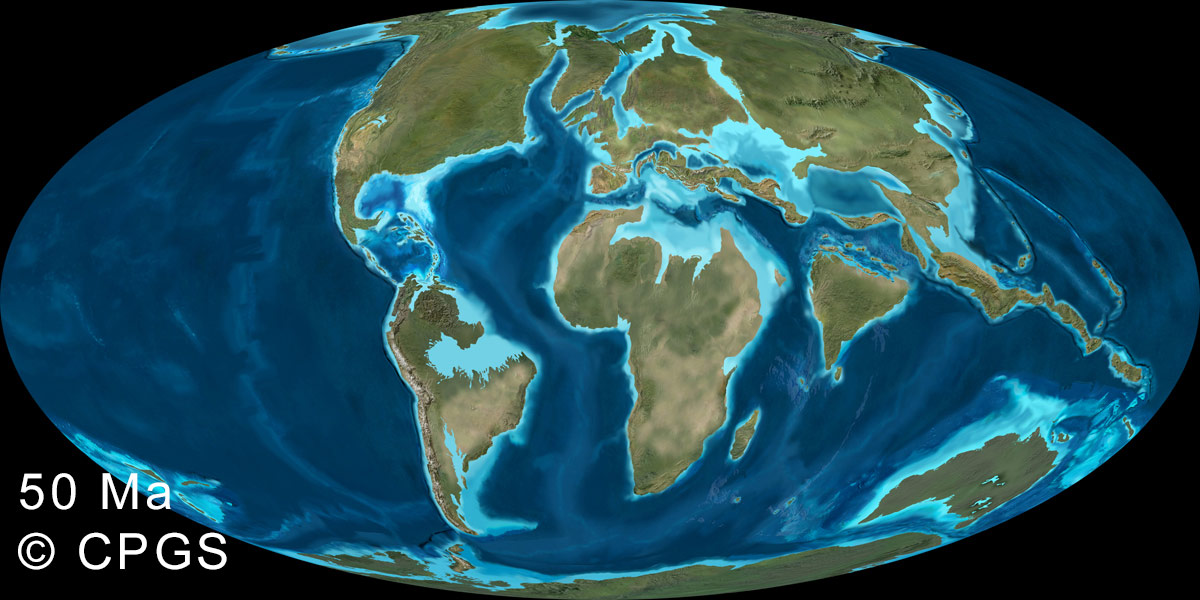
- 50 Ma Paleogene-Eocene
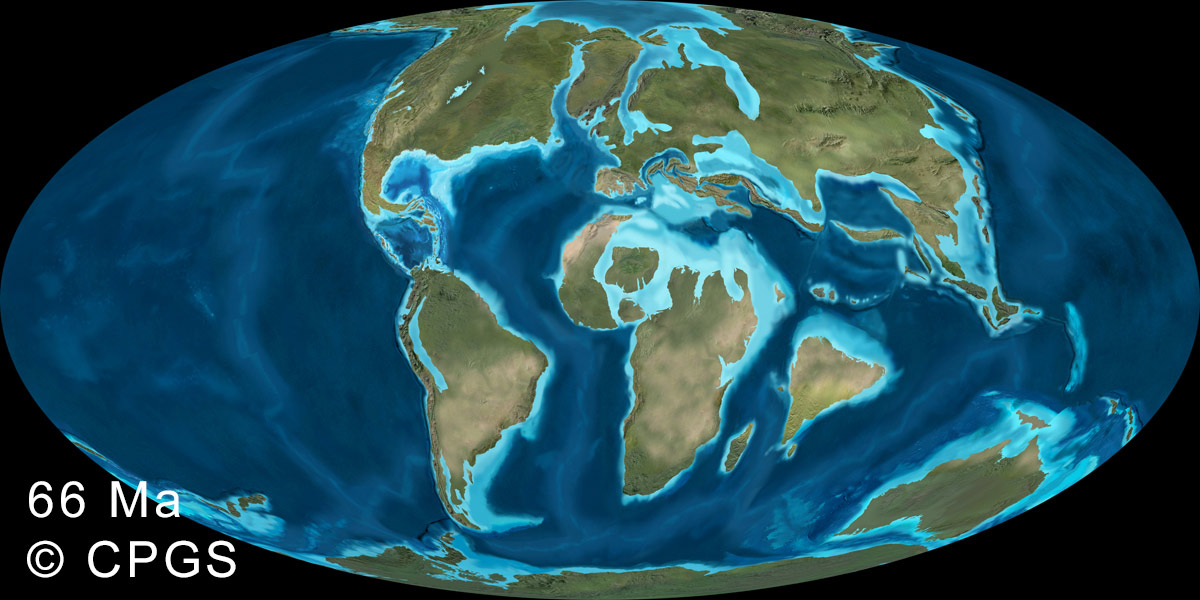
- 66 Ma Cret-Paleogene
Cretaceous Maps
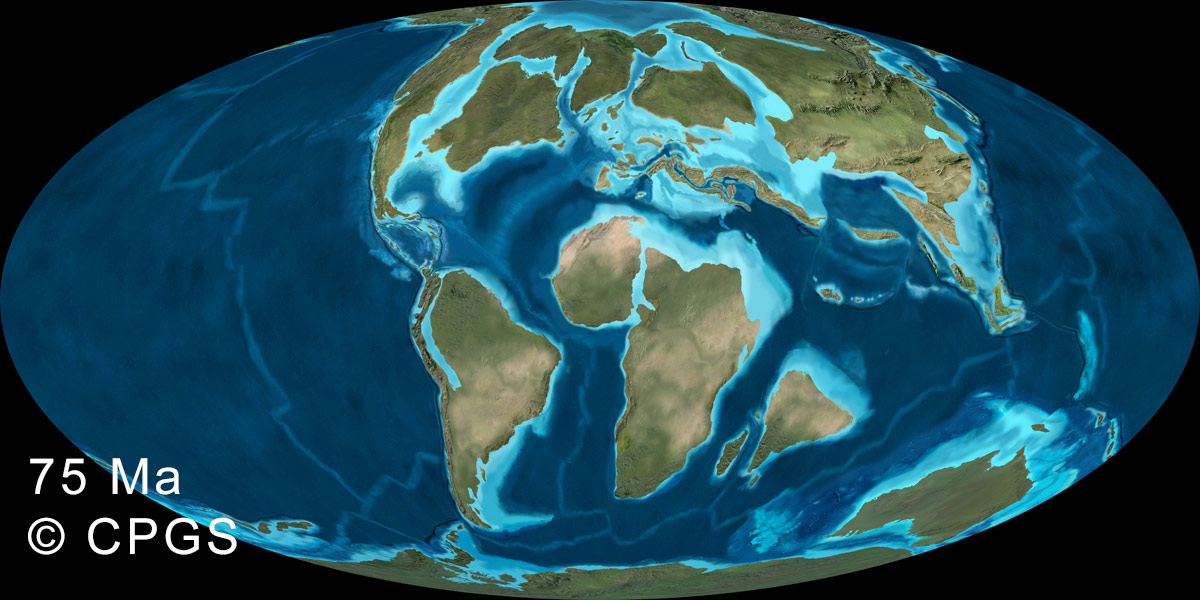
- 75 Ma U Cretaceous
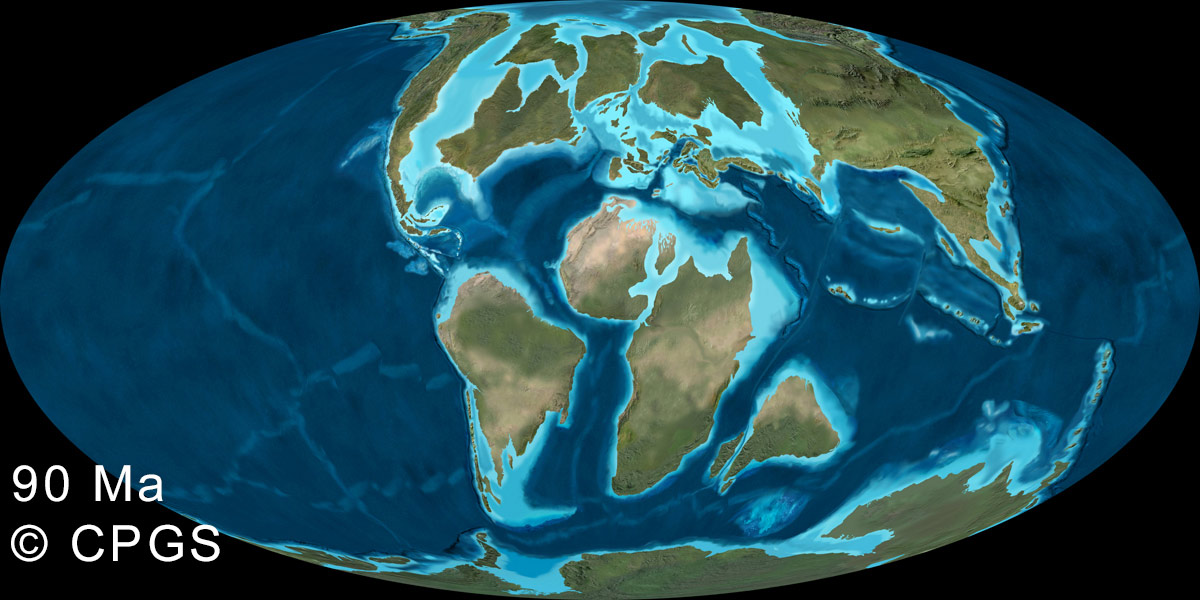
- 90 Ma U Cretaceous
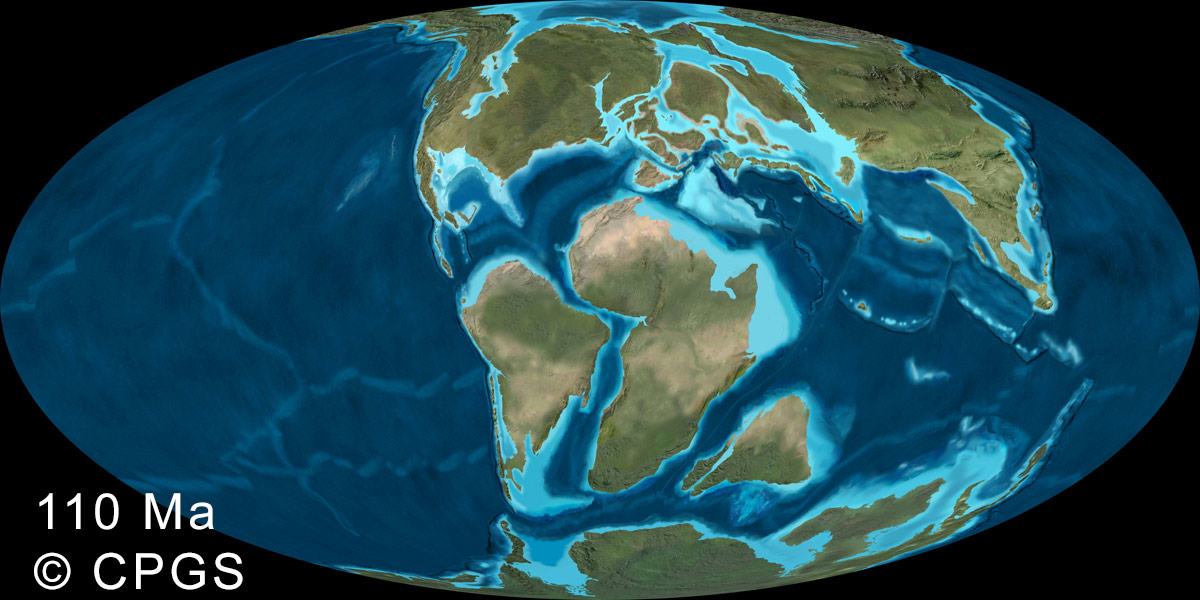
- 110 Ma L Cretaceous
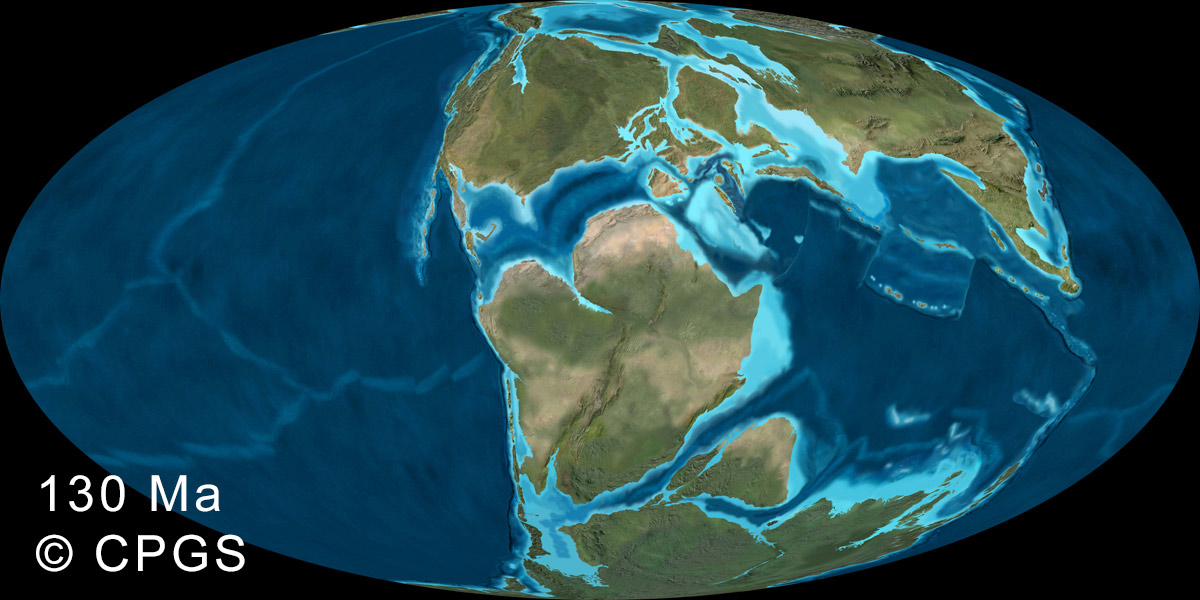
- 130 Ma L Cretaceous
Jurassic Maps
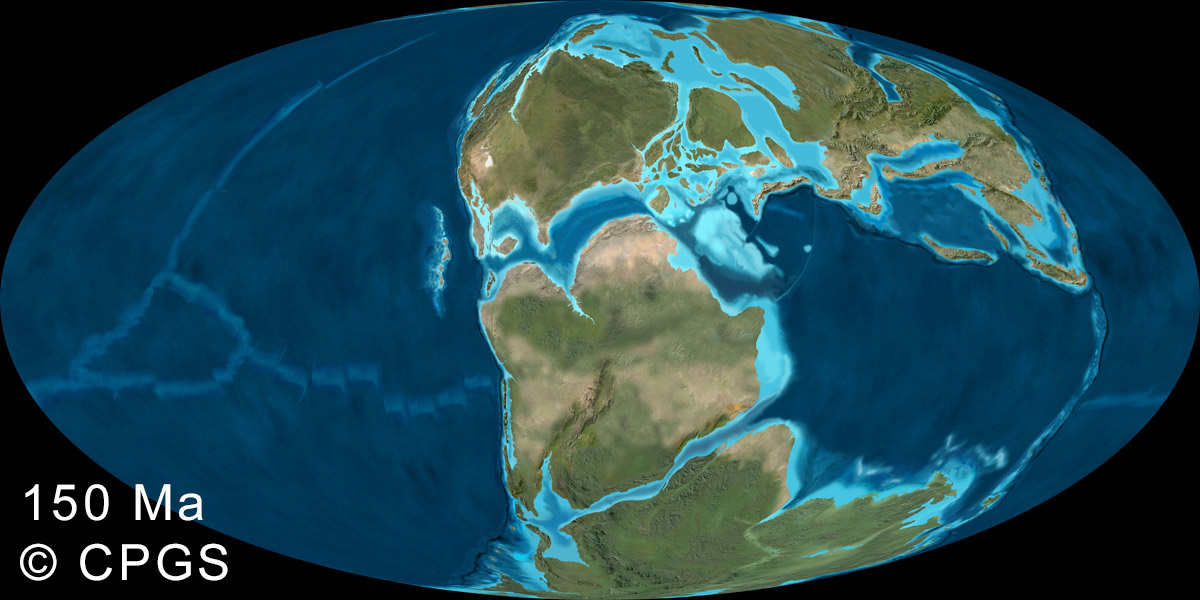
- 150 Ma U Jurassic
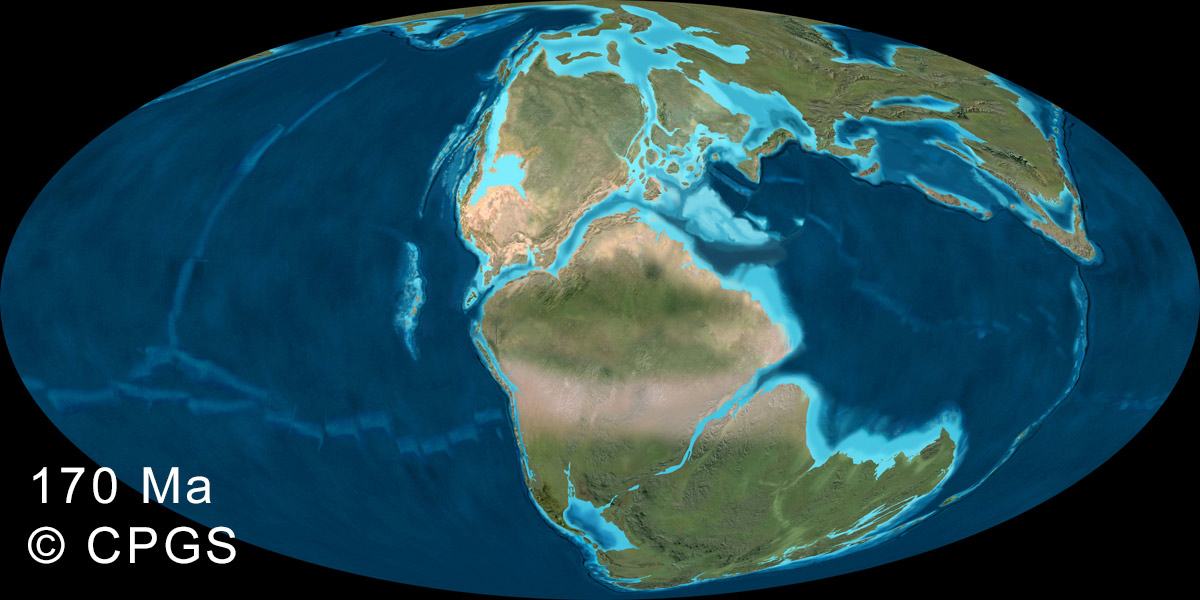
- 170 Ma M Jurassic
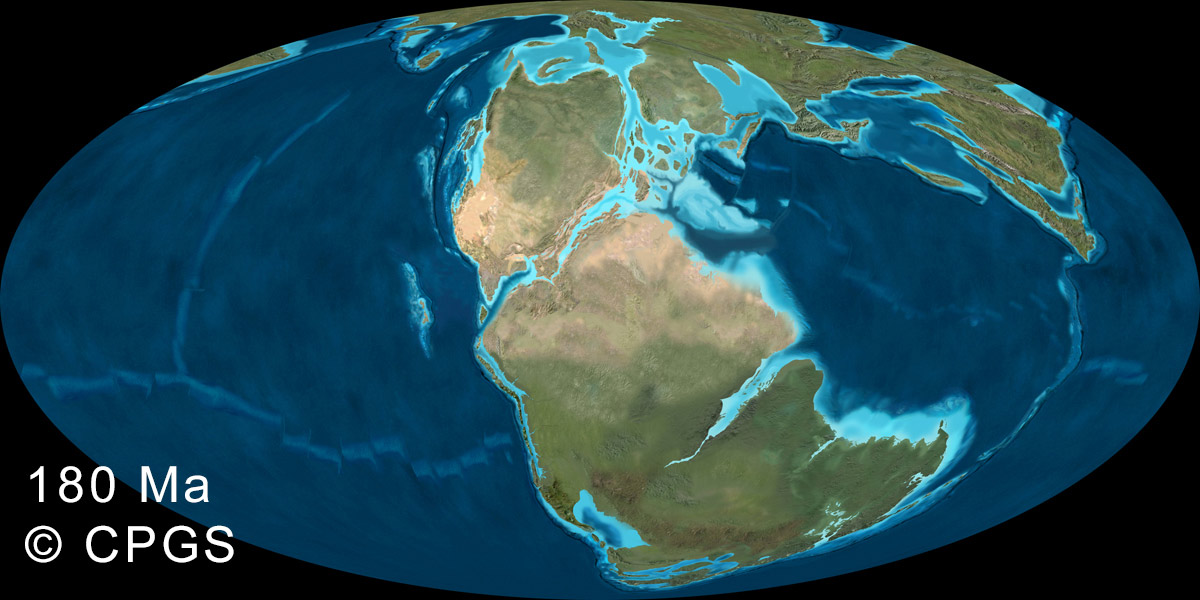
- 180 Ma L Jurassic
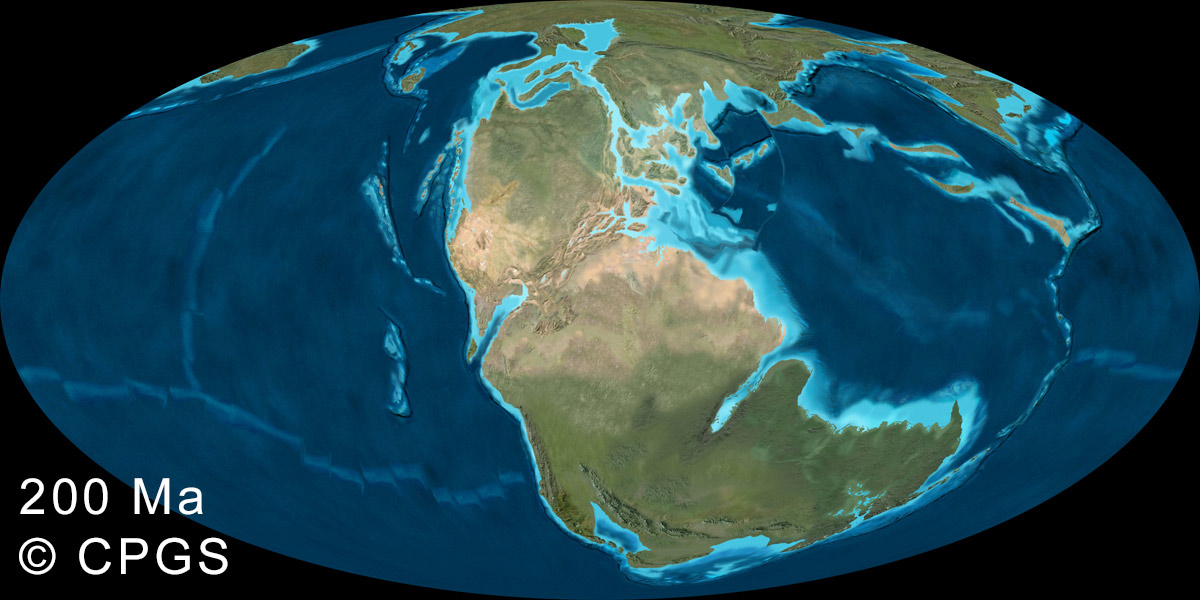
- 200 Ma Triassic-Jurassic
Triassic Maps
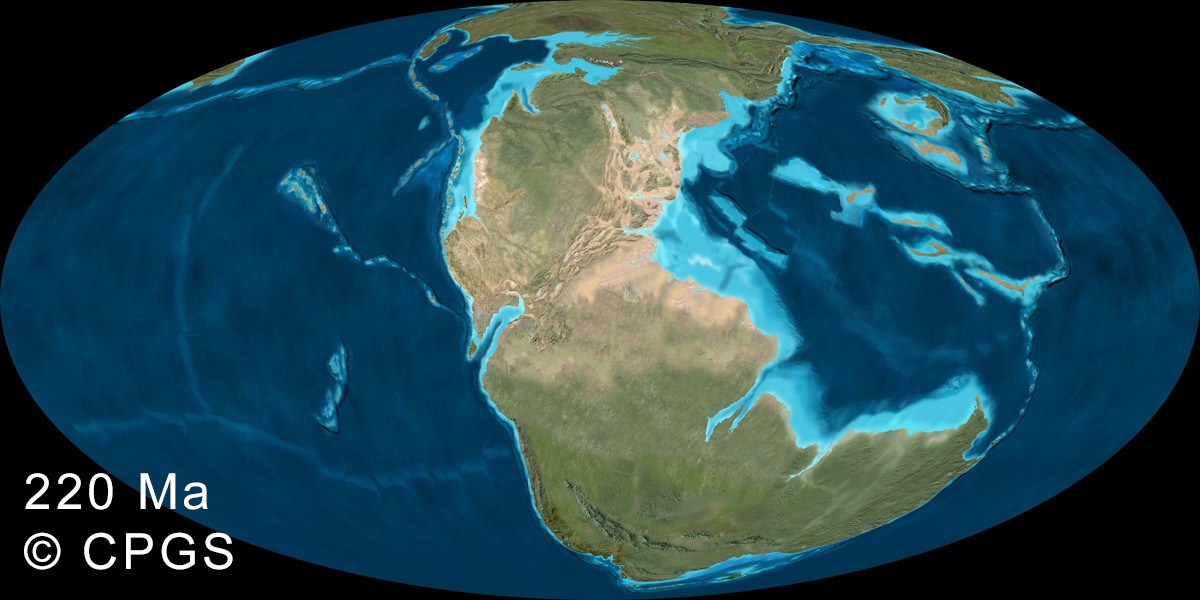
- 220 Ma U Triassic
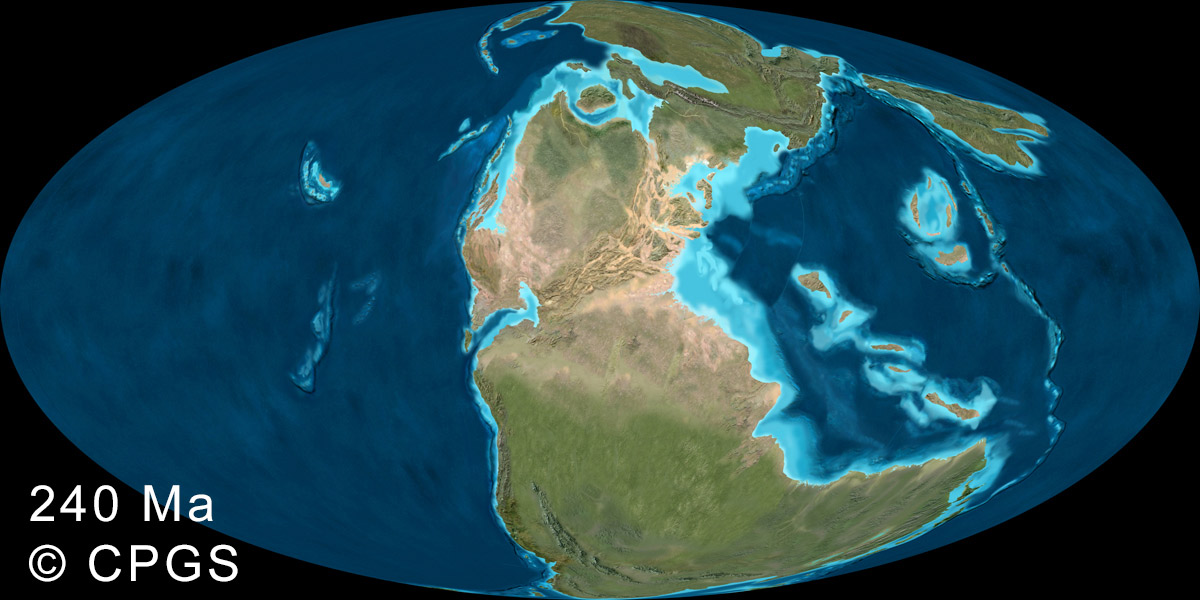
- 240 Ma M Triassic
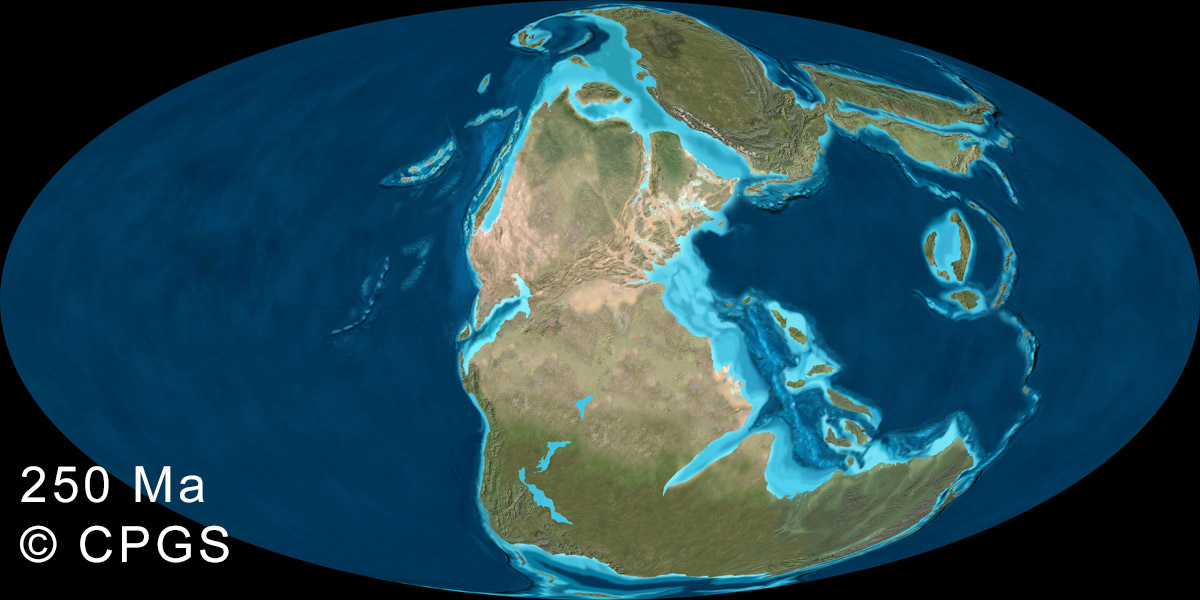
- 250 Ma L Triassic
Permian Maps
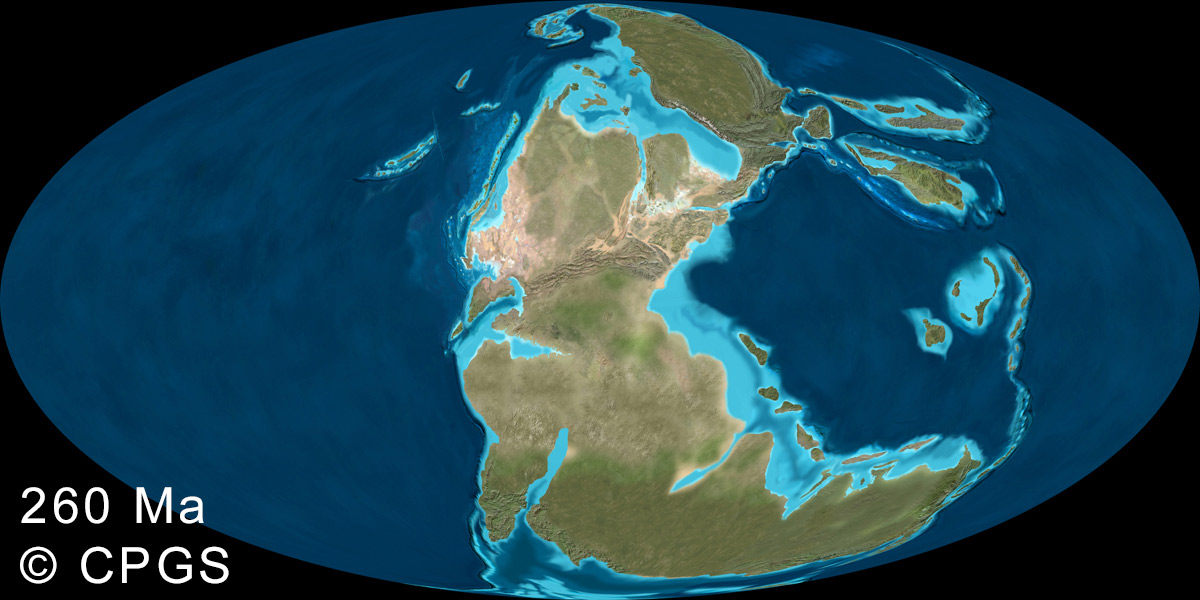
- 260 Ma M-U Permian
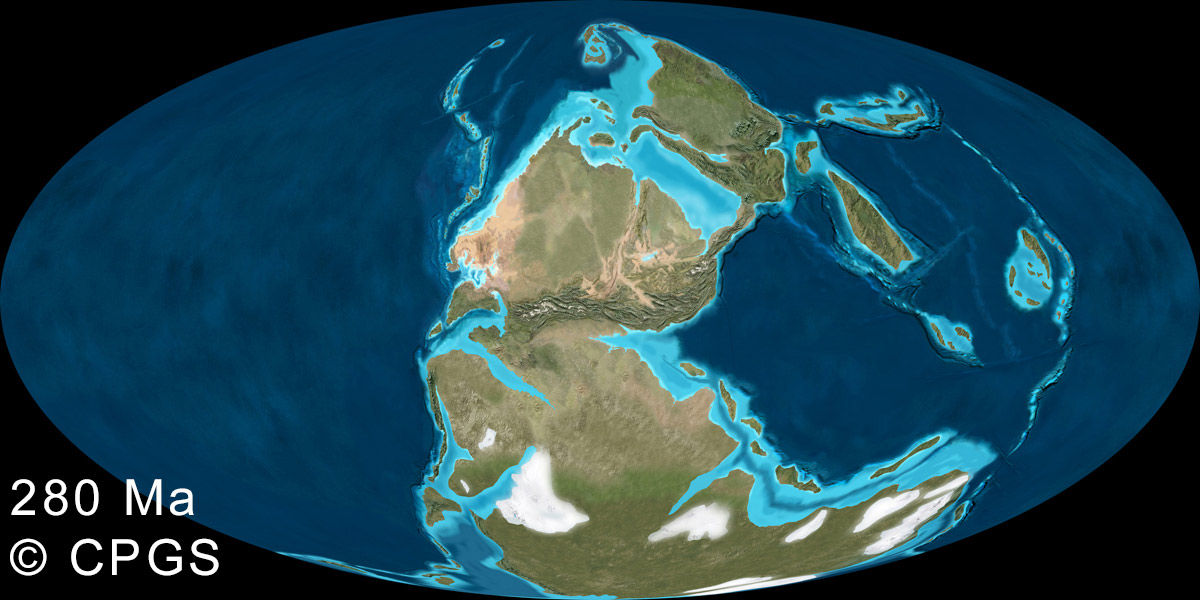
- 280 Ma L Permian
Carboniferous Maps
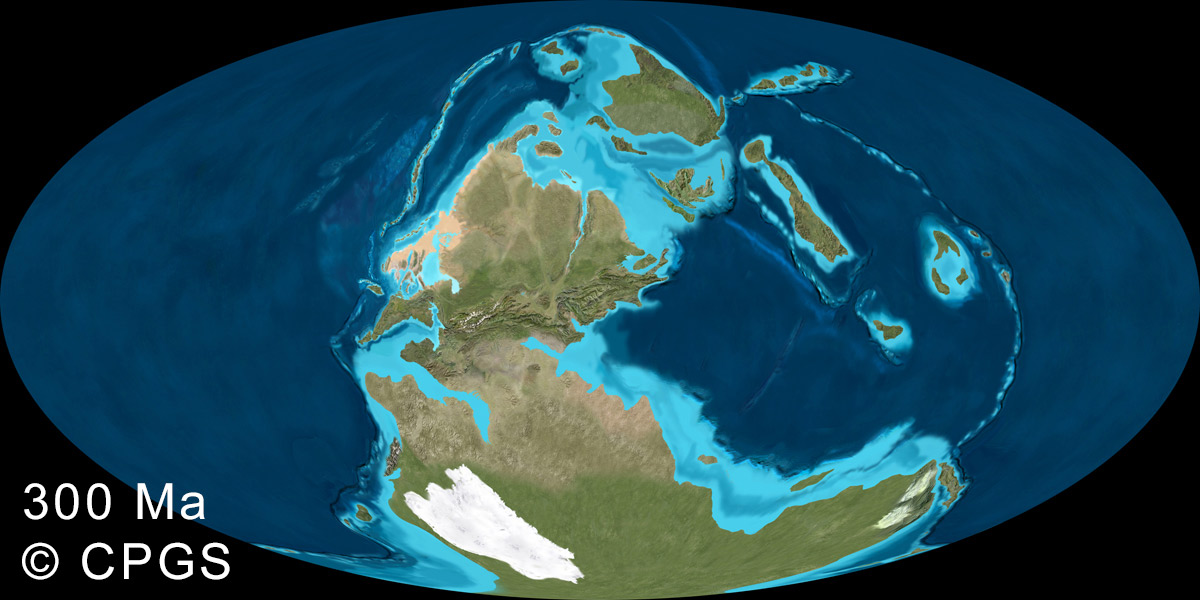
- 300 Ma U Pennsylvanian
- 320 Ma M-L Pennsylvanian
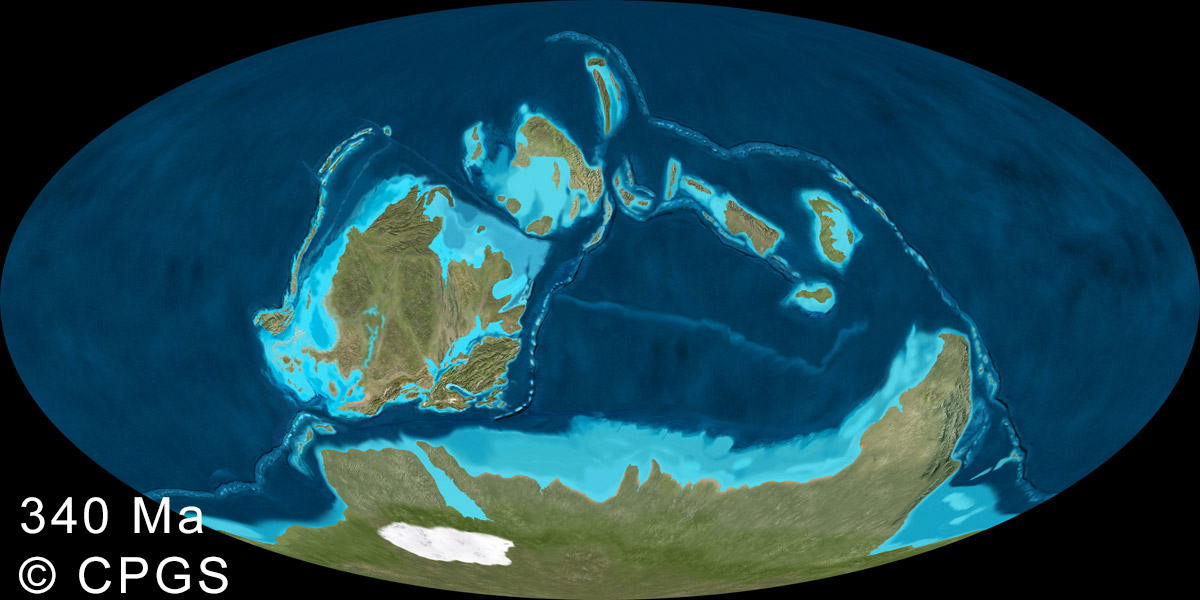
- 340 Ma M Mississippian
Devonian Maps
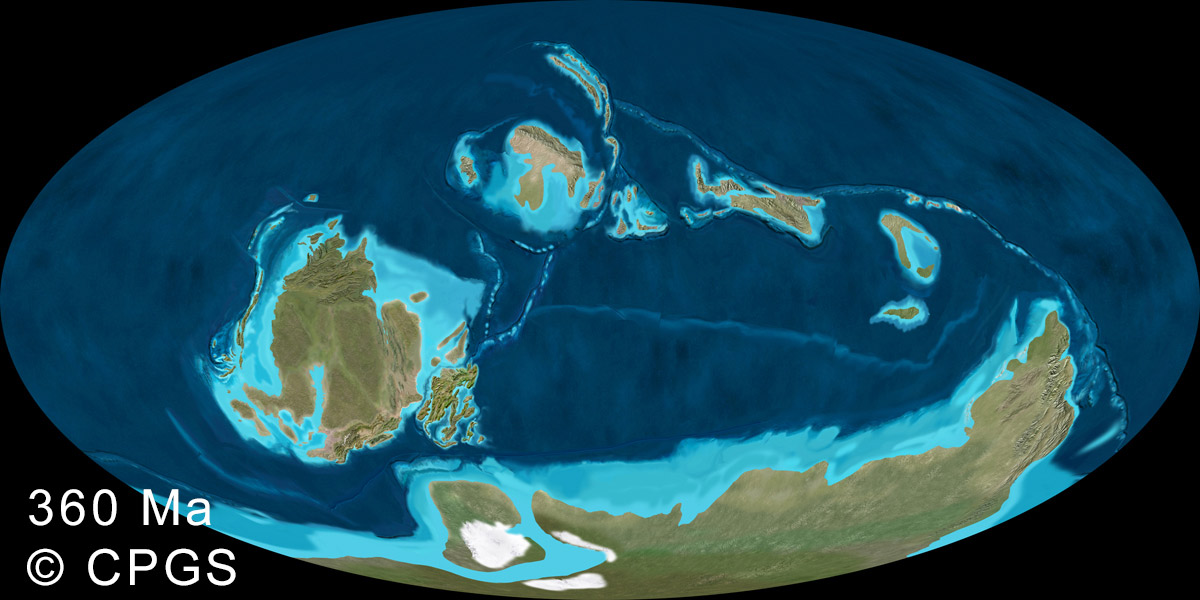
- 360 Ma U Devonian
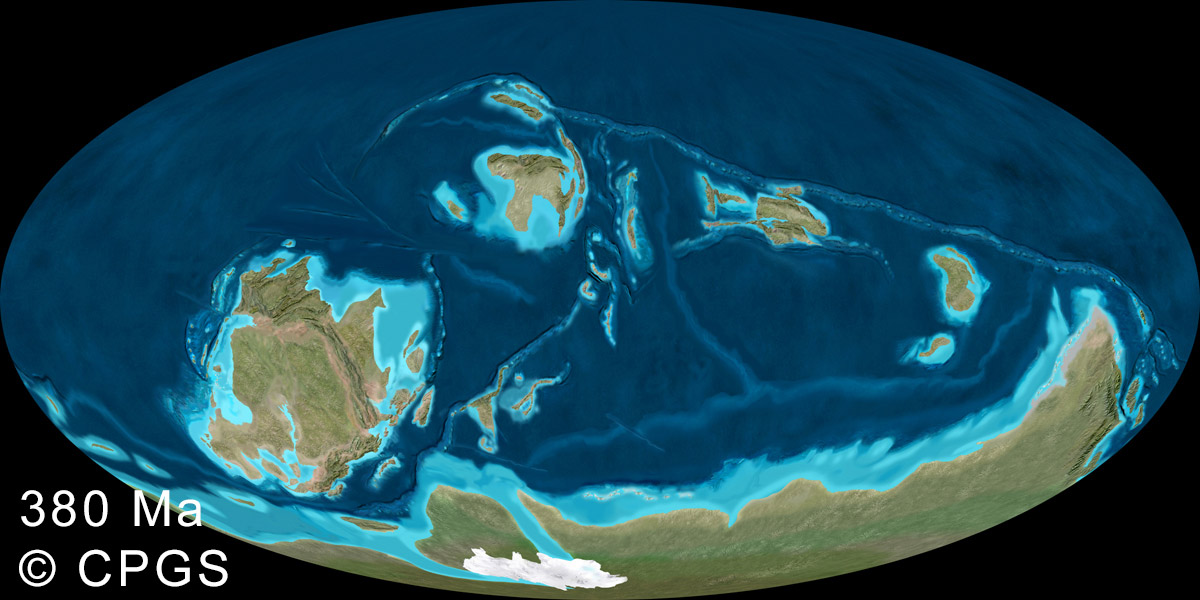
- 380 Ma M Devonian
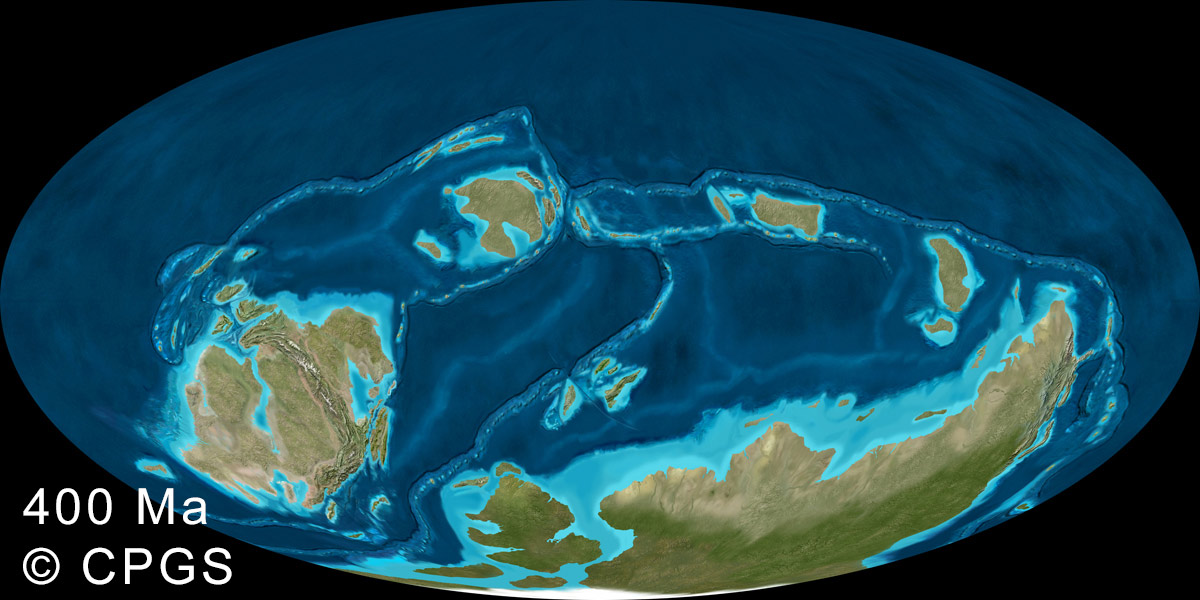
- 400 Ma L Devonian
Silurian Maps
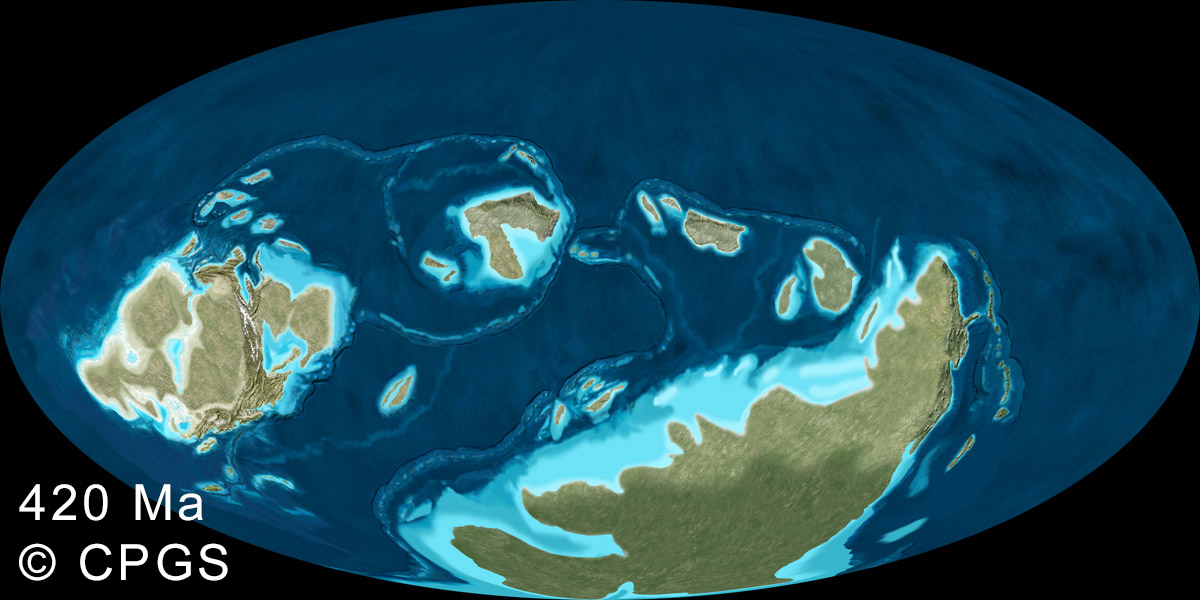
- 420 Ma U Silurian
- 440 Ma L Silurian
Ordovician Maps
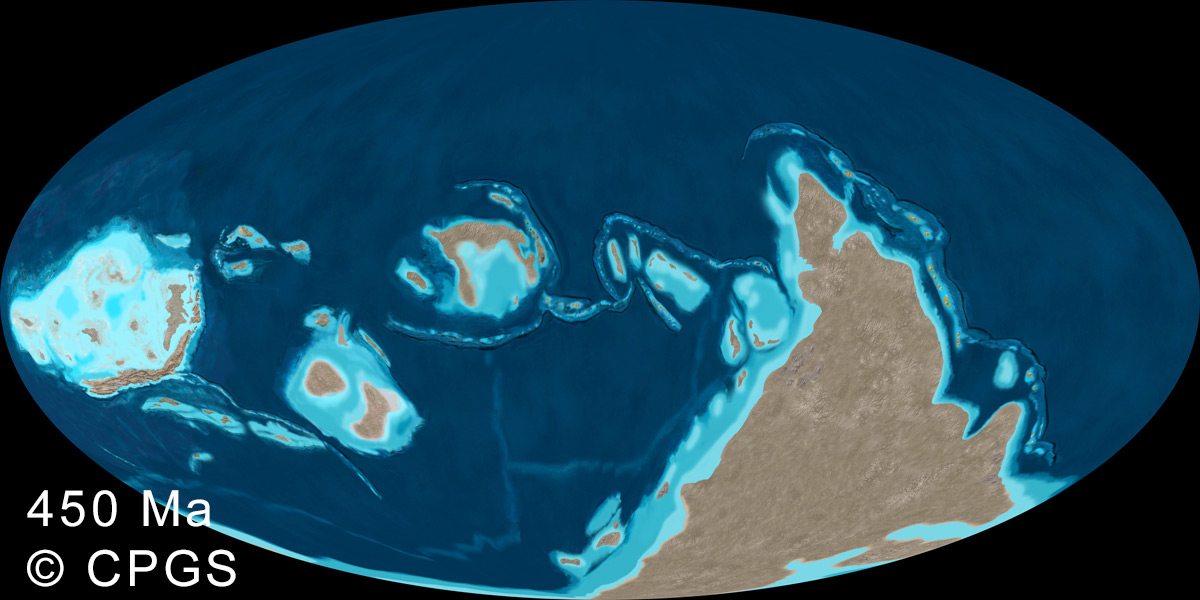
- 450 Ma U Ordovician
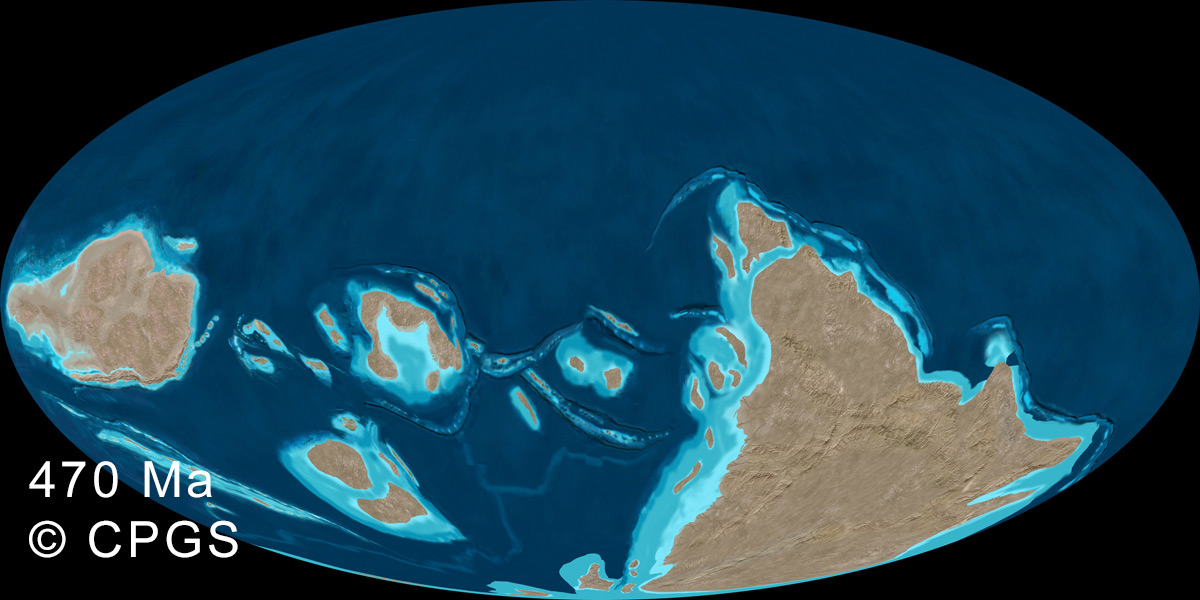
- 470 Ma M-L Ordovician
Cambrian Maps
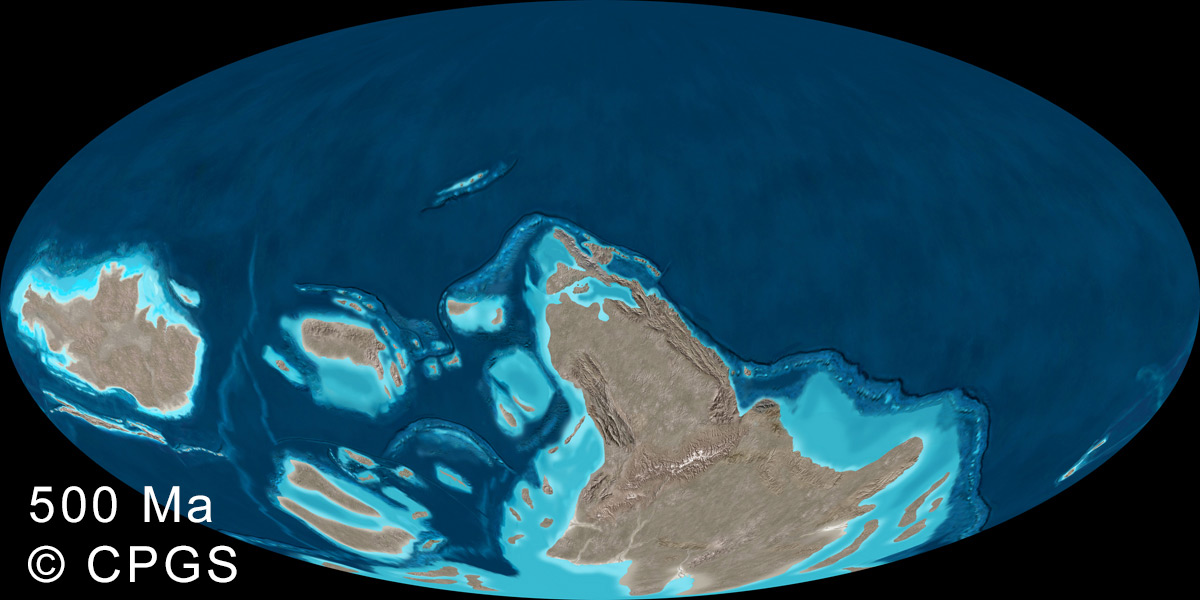
- 500 Ma M-U Cambrian
- 525 Ma L Cambrian
Click thumbnail to view full size.
Quaternary Maps
-
- 00 Ma Present
-
- 021 Ka Pleistocene (GlacMax-Wisconsin)
Neogene Maps
-
- 05 Ma Neogene-Pliocene
-
- 15 Ma Neogene Miocene
Paleogene Maps
-
- 30 Ma Paleocene-Oligocene
-
- 50 Ma Paleogene-Eocene
-
- 66 Ma Cret-Paleogene
Cretaceous Maps
-
- 75 Ma U Cretaceous
-
- 90 Ma U Cretaceous
-
- 110 Ma L Cretaceous
-

- 130 Ma L Cretaceous
Jurassic Maps
-

- 150 Ma U Jurassic
-
- 170 Ma M Jurassic
-

- 180 Ma L Jurassic
-
- 200 Ma Triassic-Jurassic
Triassic Maps
-
- 220 Ma L Triassic
-
- 240 M Triassic
-
- 250 Ma M L Triassic
Permian Maps
-
- 260 Ma M-U Permian
-
- 280 Ma L Permian
Carboniferous Maps
-
- 300 Ma U Pennsylvanian
-
- 320 Ma M-L Pennsylvanian

-
- 340 Ma M Mississippian
Devonian Maps
-
- 360 Ma U Devonian
-
- 380 Ma M Devonian
-
- 400 Ma L Devonian
Silurian Maps
-
- 420 Ma U Silurian
-
- 440 Ma L Silurian
Ordovician Maps
-

- 450 Ma U Ordovician
-
- 470 Ma M-L Ordovician
Cambrian Maps
-
- 500 Ma M-U Cambrian
-
- 525 Ma L Cambrian
Detailed Samples of Global 2026 Maps
Click thumbnails to view at larger size.
-
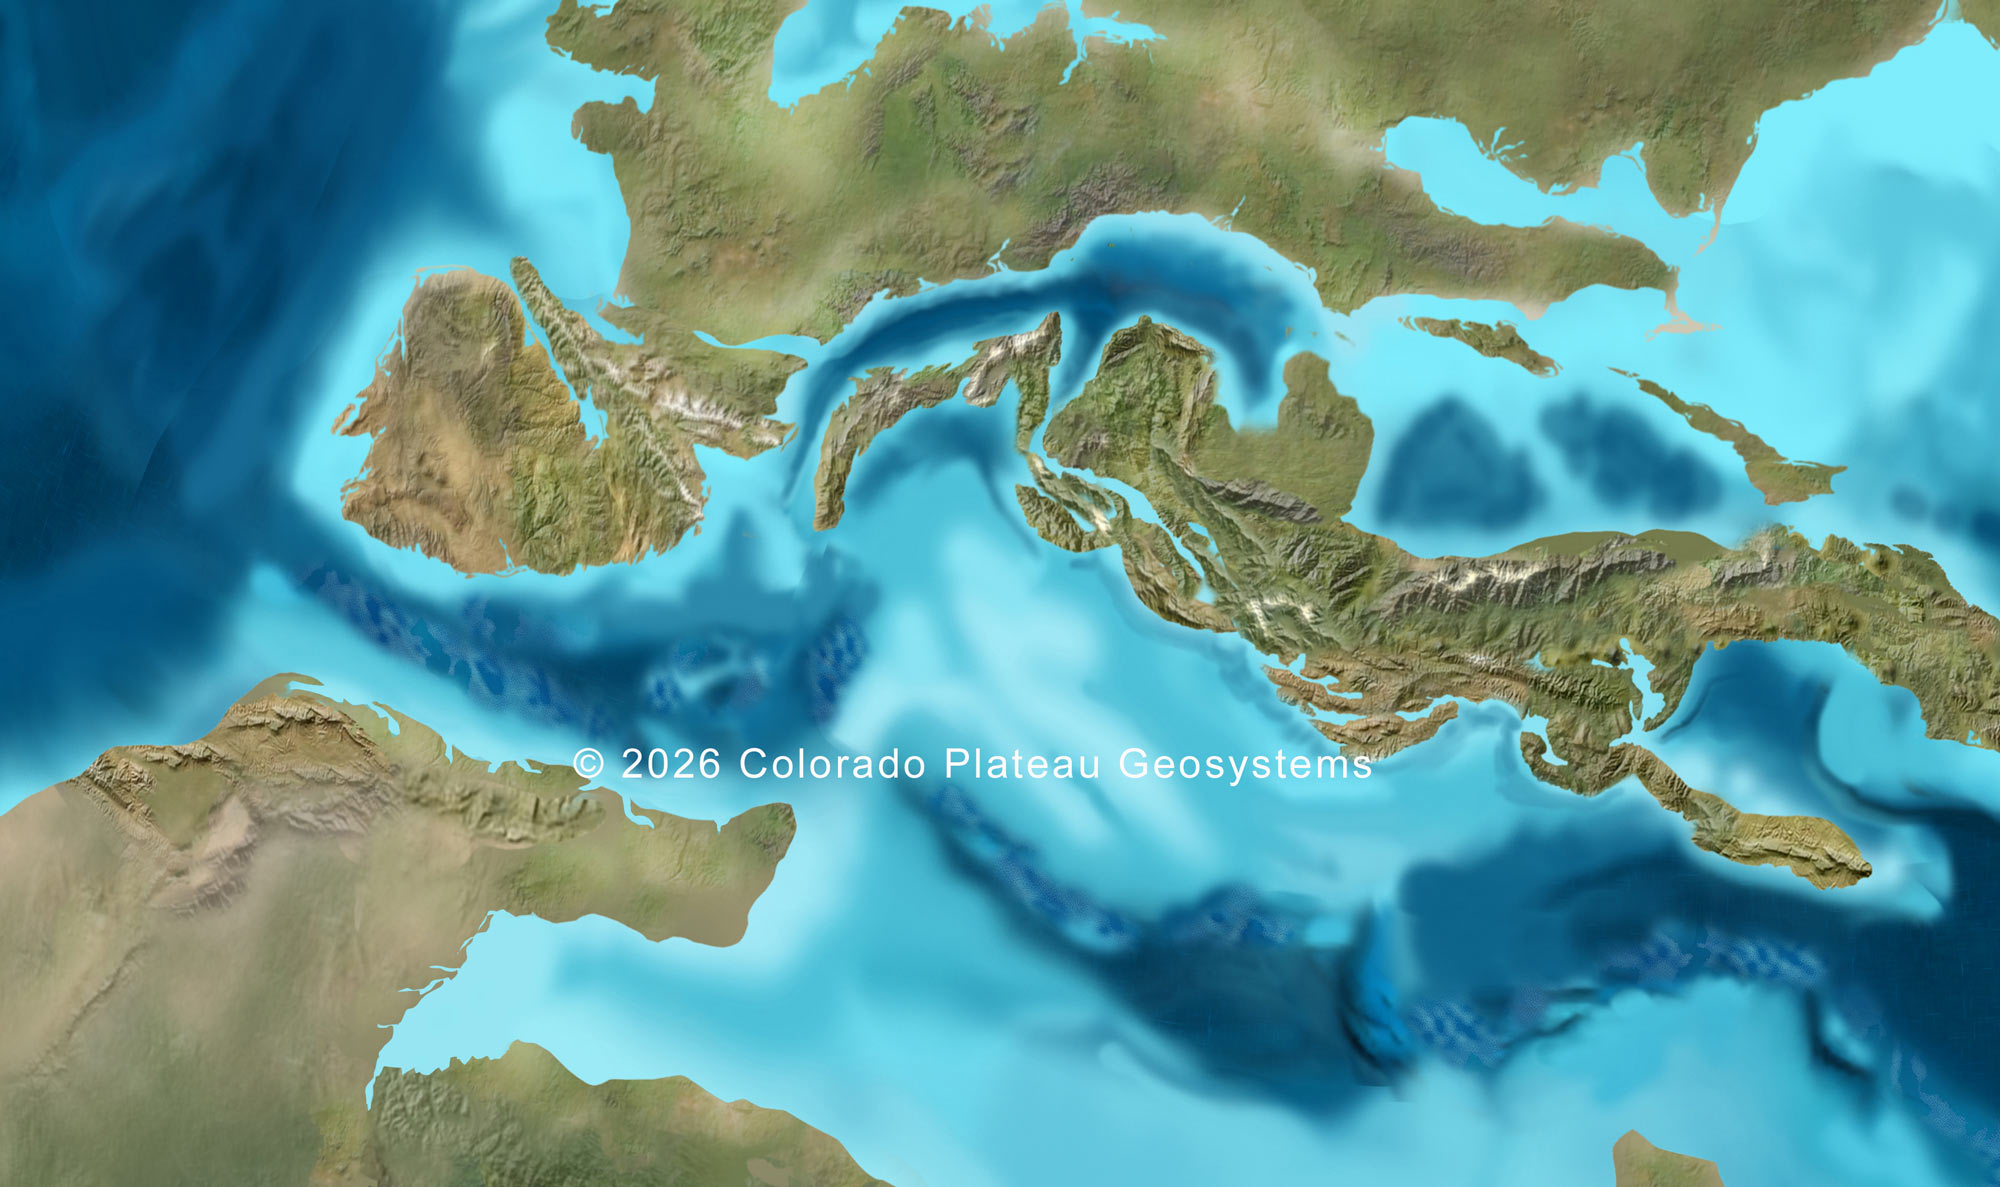
- Small crop at full resolution, rectangular view, 50 Ma, Paleogene-Eocene Africa, below, is colliding with Europe above, Adria microcontinent caught between in center. This is early stage of Alpine orogeny. Atlantic Ocean to left.
-
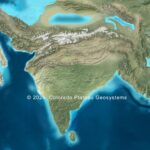
- Small crop at 50% resolution, rectangular view, 30 Ma, Paleocene-Oligocene Following its long journey from the south, India, center, plows into central Asia to form early Himalayan orogeny, Indian Ocean to south.

-
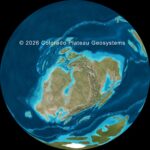
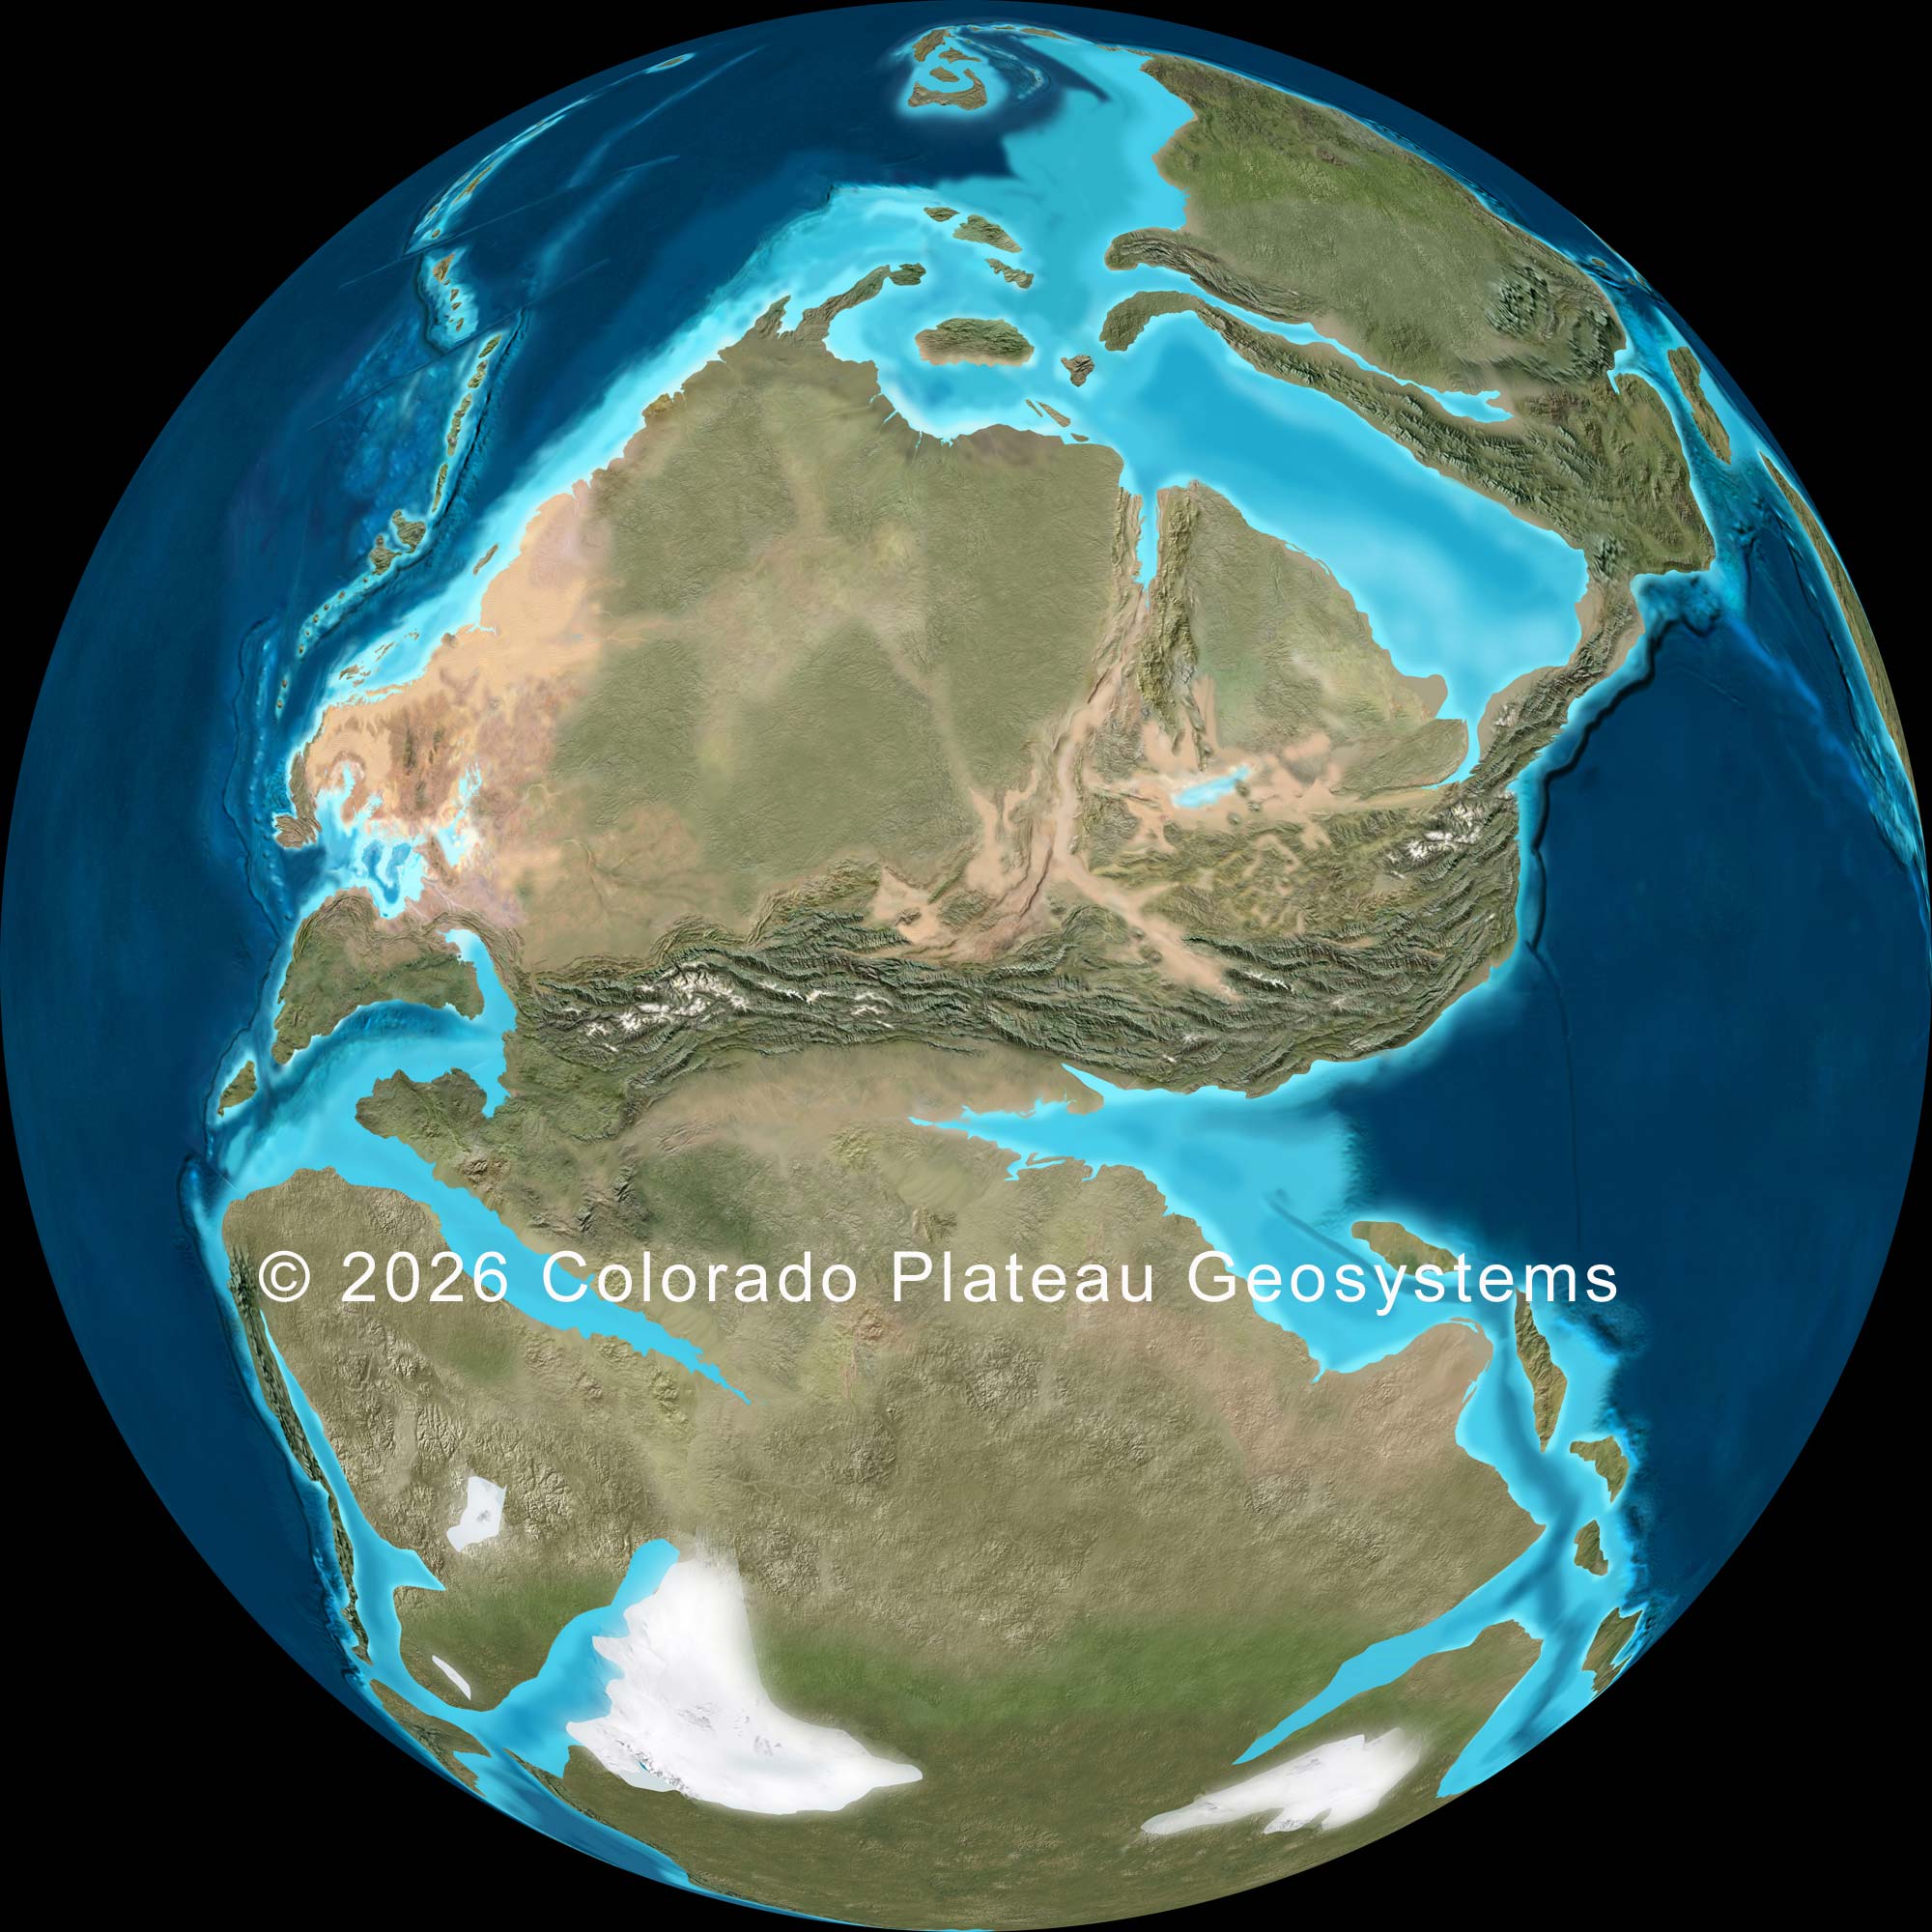
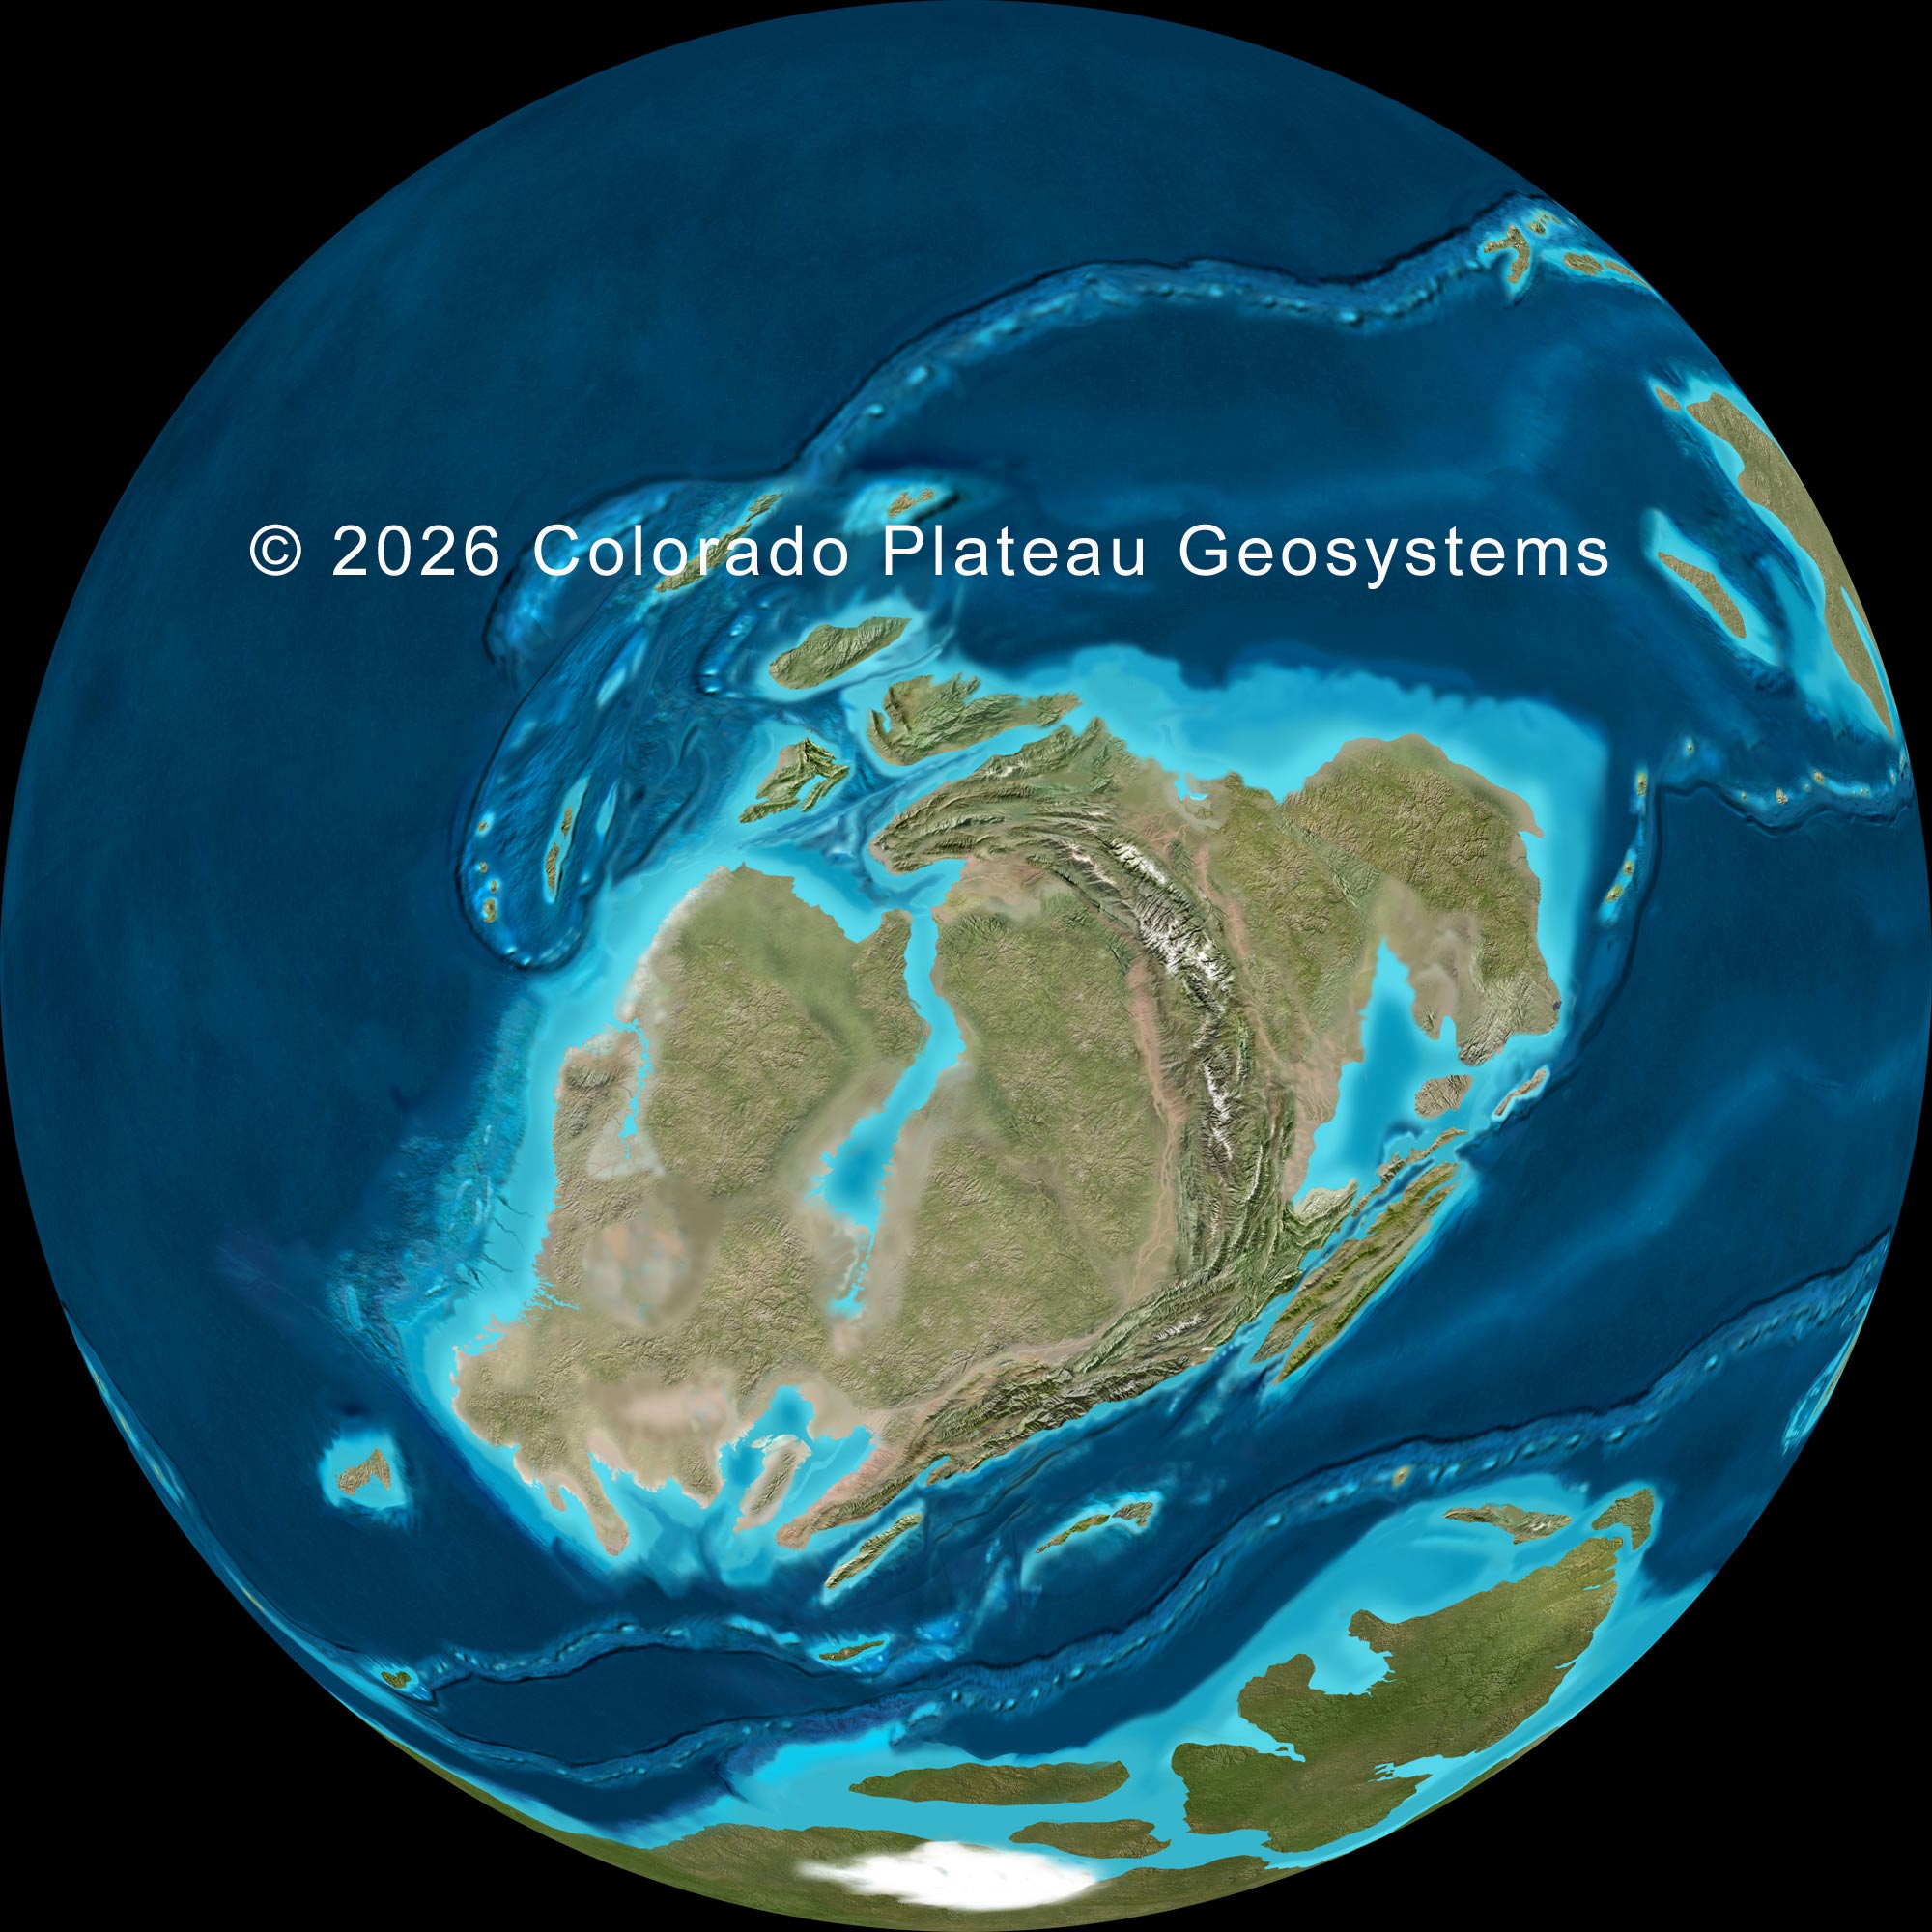
- Orthographic view, 400 Ma, Lower Devonian: North America (center left) collided with Europe (center right) to generate Caledonian orogeny. Gondwana at bottom, Siberia far upper right. (25% full size)
-
- Orthographic view, 280 Ma, Lower Permian Supercontinent Pangaea: North America and Europe upper center, Gondwana lower, Siberia/central Asia upper right. Tethys Ocean far right, Panthalassa Ocean (Paleo-Pacific) left. Appalachian/Variscan Mountains mark zone of major collision. (25% full size)