Western Interior Seaway (NAM)
- 44 time slices 140 – 65 Ma, Cretaceous to Paleocene
- Covers central and western North America
- 7251 x 9034 pixels
- 20 – 26 MB (Mega Bytes)
- Jpeg format
- © 2023
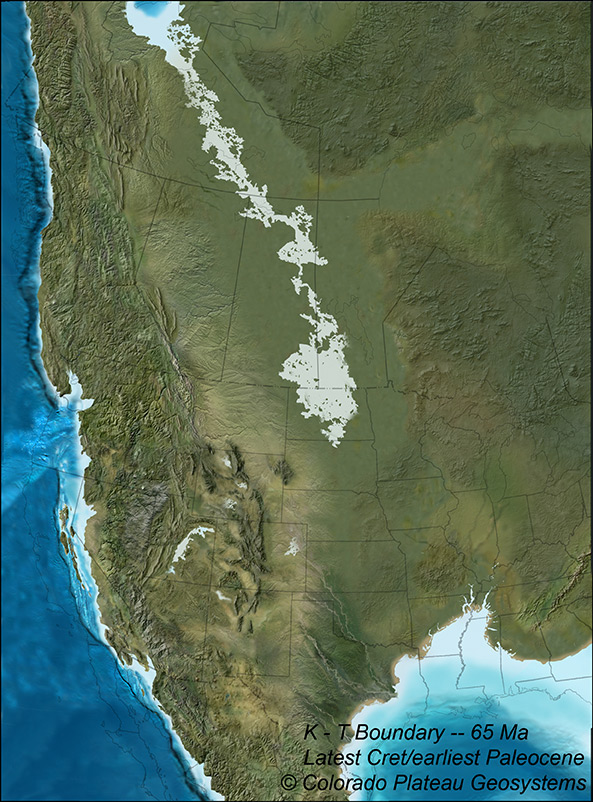
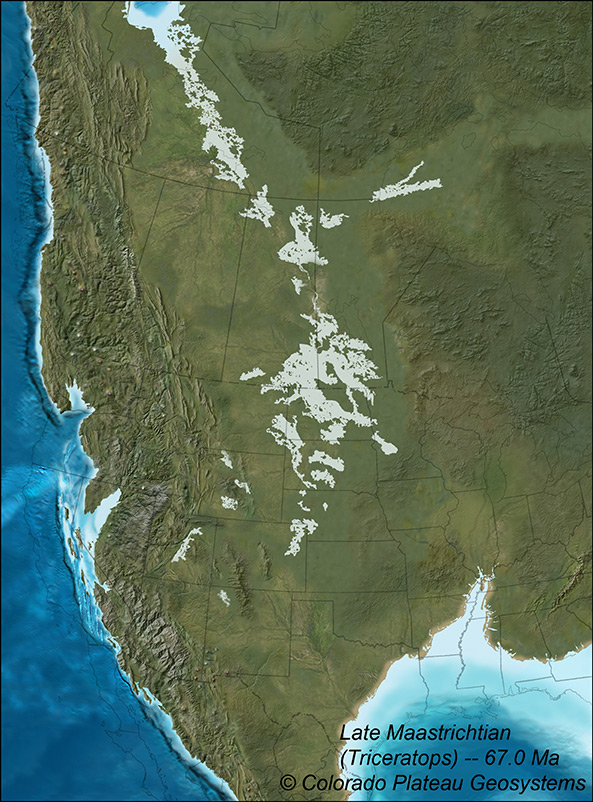
The recently revised (September 2023) Western Interior Seaway series (WIS) includes 44 Cretaceous maps that range from 140 – 65 Ma. The Late Cretaceous has especially closely spaced time slices, many less than ½ million years apart. This allows for accuracy in examining narrow slots of geologic time. The series traces the history of North America’s Western Interior Cretaceous Seaway from its inception in northwest Canada through its greatest extent from Alaska to the Gulf of Mexico during the Turonian to Campanian (subdivisions of Cretaceous time, 94 – 77 Ma), to its demise in the Maastrichtian (Ca. 67 Ma). The rocks deposited during the numerous marine transgressions and regressions in both continental and marine environments contain vast natural resources including hydrocarbons and coal, rich dinosaur remains, widespread ammonite fossils and other fossil remains, and important scenic resources in numerous National Parks in both the US and Canada. Additionally, these rocks have formed the basis for modern stratigraphic studies including sequence stratigraphy. The fact that these rocks comprise the most studied rocks on Earth, allow the details presented in this series possible.
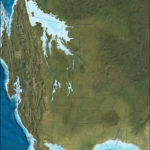
The maps are 7251 pixels E-W x 9034 Pixels N-S, nearly three times larger than the older series. The region covered ranges from the Yukon and adjacent Eastern Alaska, through British Columbia, Alberta, and Saskatchewan, southward through the US Western Interior to Mexico, and east to the Gulf Coast. Also detailed is the Cordilleran region from Alaska to Mexico and the important Sevier Thrust Belt. The relations between the Cordilleran accretion and magmatism, the growth of the Sevier Thrust Belt, and patterns of transgression and regression across the Western Interior Seaway are clearly shown. Latitude lines 30° and 60°N are also shown. A reference list used in constructing the maps is also available.
Late Cretaceous time slices are tied to the Cretaceous biostratigraphic zones, mostly ammonite zones (see list of maps) The chronostratigraphic ages are given in millions of years ago (Ma) and follow the International Chronostratigraphic Chart — ICC (time scale) of 2020. The ages of the fossil zones given on the maps identify the first appearance of the fossil zone; most Late Cretaceous fossil zones lasted less than one-half million years, some less. The Period-Epoch-Age/Stage names also follow the ICC.
The WIS maps use the same scale and projection as the new North America in Deep Time Series but are cropped to show the area of interest listed above. Fifteen NA Deep Time maps (140, 125, 120, 105, 98, 93, 89, 87, 84, 82, 80, 77, 70, 67, and 65 Ma) overlap with the WIS maps; to show all North America for these time slices order the NA series. A huge volume of references was used to generate the patterns of the Western Interior Seaway and adjacent landscapes. Voluminous paleontological work and radiometric dating of numerous bentonite beds (altered volcanic ash) coupled with excellent outcrop exposures and immense subsurface data provide the basis for the detailed basin wide correlations.
Some areas of the Canadian Shield, Appalachians, and the greater Great Lakes regions lack Cretaceous rocks. These areas are shown similarly on most of the maps. This does not mean that these areas didn’t change during the 80 million years covered on the various maps, but rather reflects a lack of data to enable changes to be shown.
Map projection (transverse Mercator) is from Garrity, C. P., and Soller, D. R., 2009, Database of the map by J. C. Reed, Jr., and others (2005): US Geological Survey data series 424 (DVD).
The greatest detail and accuracy of the maps focuses on the western shore of the Western Interior Seaway and US Gulf Coast from Alberta to East Texas. Shoreline features are based on the nature of the shorelines with respect to patterns of transgression, regression, regional subsidence, and sediment supply. Individual bars and coastal indentations are diagrammatic but based on data from the literature. In other words, a given bar form or other shoreline feature shown (delta, estuary) on the map is hypothetical, not necessarily showing a specific bar, but rather represents the nature of a known or inferred barred coast – what the coast might have looked like rather than what it did look like. The geometry of the western coastal pain is constrained by the position of the shoreline and the position of the Sevier thrust belt at any given time. Orientation of rivers is from facies and paleocurrent data. The geometry and movement of the thrust belt is from DeCelles (2004); palinspastic restoration of the Cordilleran region is after Dickinson (2011; 2013). The N-S location of Wrangellia, a prominent accreted terrane, is controversial and the maps show an intermediate position between the numerous reconstructions in the literature.
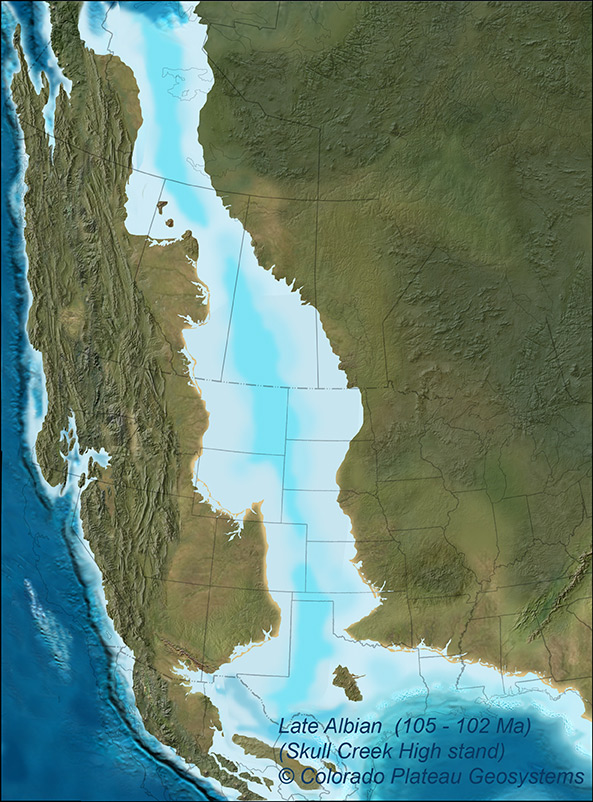
Water depths, suggested by shades of blue, are qualitative, not quantitative. Very pale shades suggest deposition above wave base with water depths 0-50 m (0-150 feet). Deepest waters were likely towards western edge of sea as that is area of maximum subsidence (but also highest sedimentation rates). During rapid sea level rises, sediment was trapped near shore, so water depths were likely greatest then. Maximum water depths in the WIS may have been greater than 200 m (600+ feet). Ocean depths shown in deeper blues range to 3-5 kms on abyssal plains to 8+ kms in trenches (shown as very dark furrows).
The eastern shoreline is less well known. Nearly all Upper Cretaceous deposits on the eastern margin of the seaway lack preserved shoreline and coastal plain deposits – commonly easternmost deposits consist of offshore marine deposits that formed some uncertain distance offshore. Various extrapolation techniques based on scattered data such as Cretaceous rocks and fossils in Pleistocene glacial deposits provide some constraint. Deposits in the Hudson Bay area are speculative (see Ziegler and Rowley, 1998).
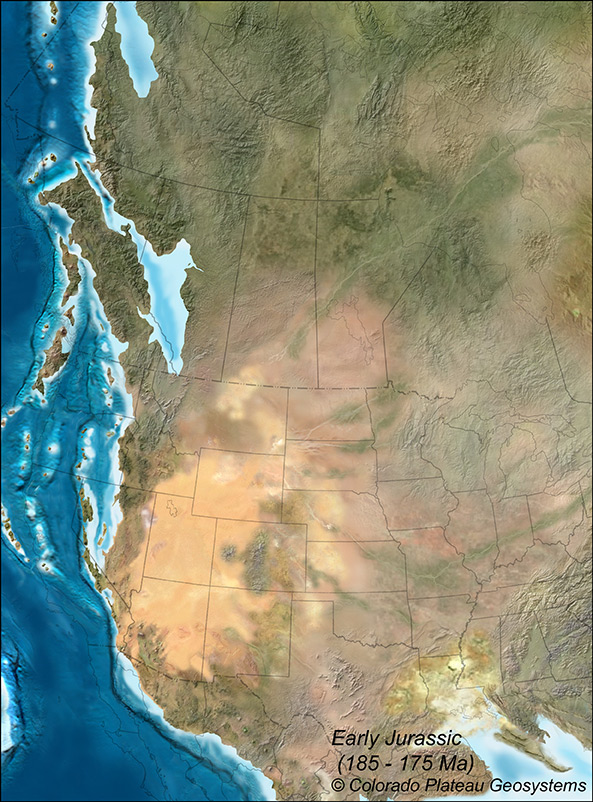
Jurassic rocks that contain the oldest record of the WIS and were included in the previous WIS series are now available in the comprehensive NA Deep Time Series.
Additional Notes:
- Maps are rasterized pixel images and are not shape files (nor are they based on shape files)
- Peleogeographic and paleotectonic elements (thrust belts, volcanic centers, paleo-shorelines, dune fields, basin geometry, facies maps, etc.) are plotted from the geologic literature and redrawn, repositioned, or reprojected on the base maps for the given time slices. This information is then used to construct the paleogeography.
- Paleogeography is cloned or painted using Photoshop®; cloned images are mostly from GeoMapApp, a marine geoscience, global topography data system (http://www.geomapapp.org/).
- Cloned modern Earth DEM images from GeoMapApp are selected as modern analogues to the paleo-features they are chosen to represent; most DEM images have been re-colored, resized, and/or re-shaped in Photoshop®.
- All map elements, both internal to North America and fringing or exotic, are palinspastically restored to each given time slice using recent data from literature.
- Paleoclimate patterns, shown via hues of greens (humid) vs browns and tans (semi arid, arid), are generalized.
Western Interior Seaway © 2023 List of Maps
44 Total time slices
| Paleocene | 65 Ma |
| UK Late Maastrichtian (remnant sea?) | 67 Ma |
| UK Late Maastrichtian (last phase WIS) | 68 Ma |
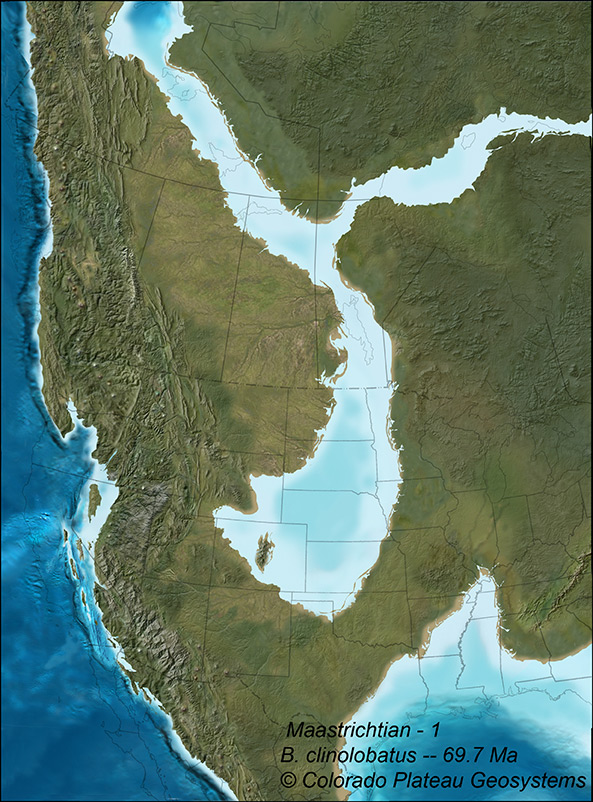
| UK Early Maastrichtian (B clinolobatus) | 69.7 Ma |
| UK Early Maastrichtian | 70.0 Ma |
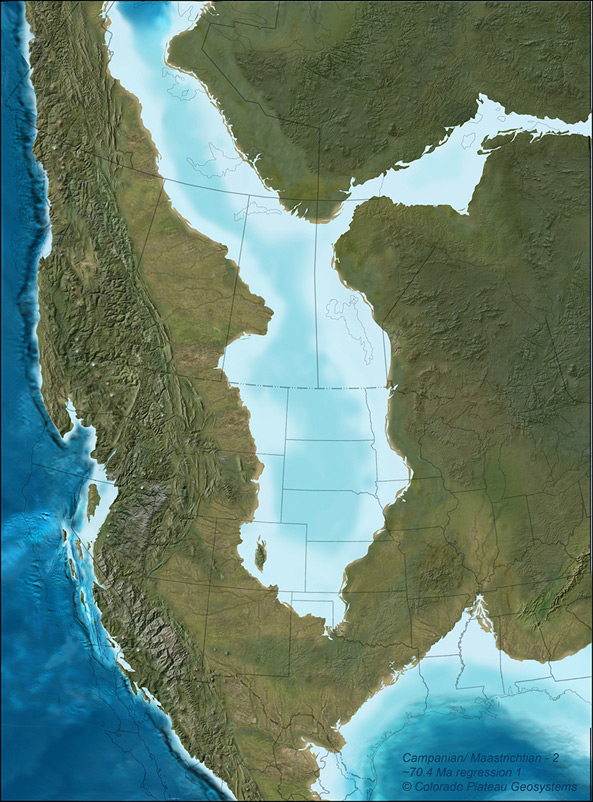
| UK Early Maastrichtian | 70.4 Ma |
| UK Early Maastrichtian (regression) | 70.8 Ma |
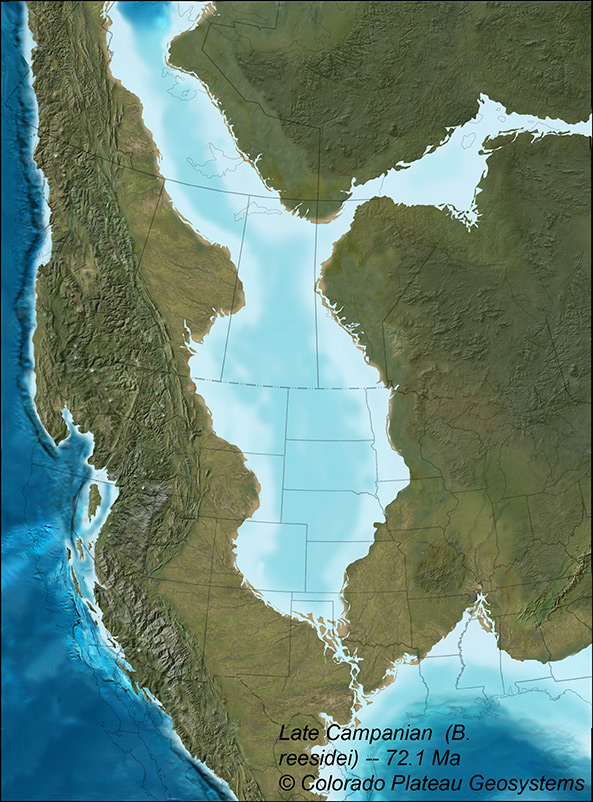
| UK Late Campanian (B reesidei) | 72.1 Ma |
| UK Late Campanian (B compressus) | 73.5 Ma |
| UK Middle Campanian (B scotti) | 77.0 Ma |
| UK Middle Campanian (B perplexus) | 78.2 Ma |
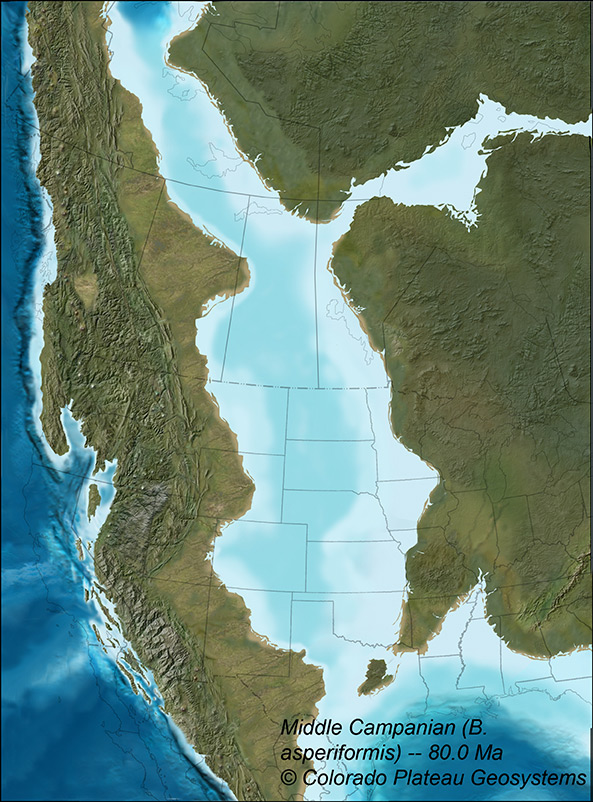
| UK Middle Campanian (B asperiformis) | 80.0 Ma |
| UK Middle Campanian (B maclearni) | 80.4 Ma |
| UK Middle Campanian (B obtrusus) | 80.6 Ma |
| UK Early Campanian (Baculites sp. weak) | 80.9 Ma |
| UK Early Campanian (Baculites sp. smooth) | 81.2 Ma |
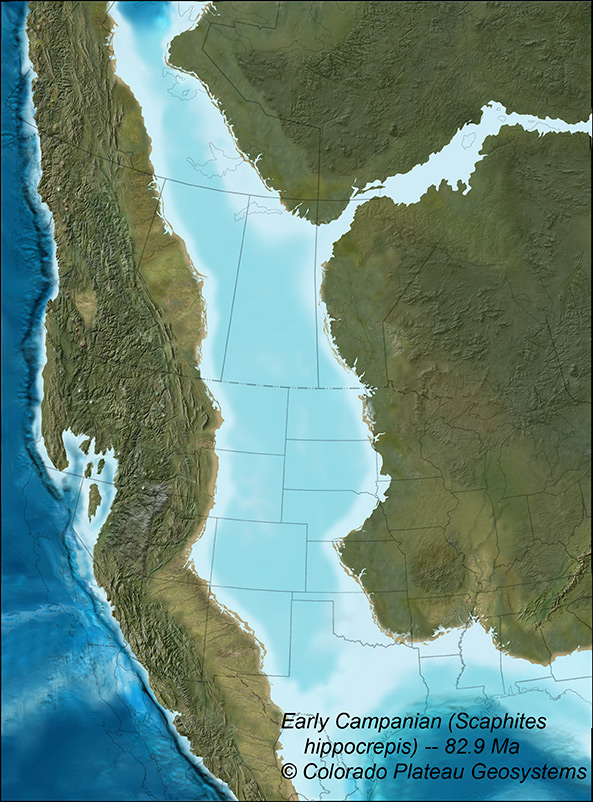
| UK Early Campanian (Scaphites hippocrepis) | 82.9 Ma |
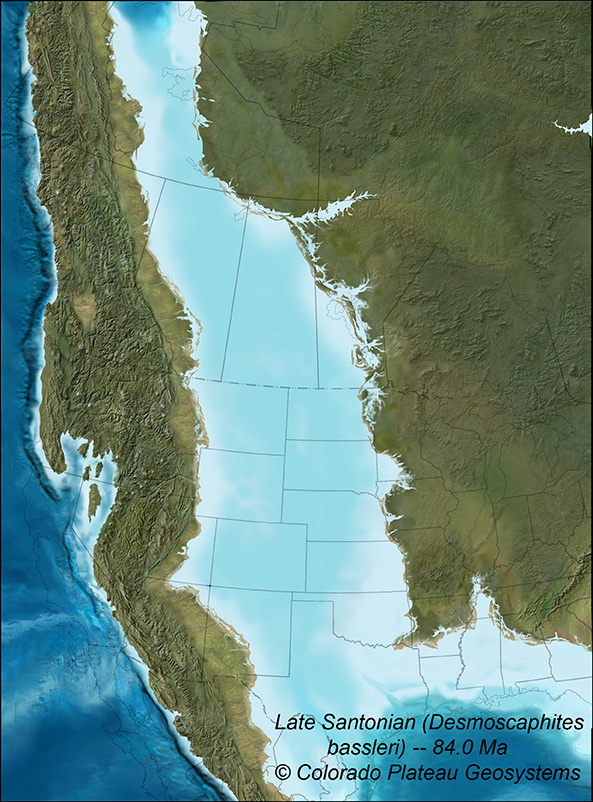
| UK Late Santonian (Desmoscaphites bassleri) | 84.0 Ma |
| UK Middle Santonian (Clioscaphites veriformis) | 84.9 Ma |
| UK Late Coniacian (Scaphites depressus) | 87.0 Ma |
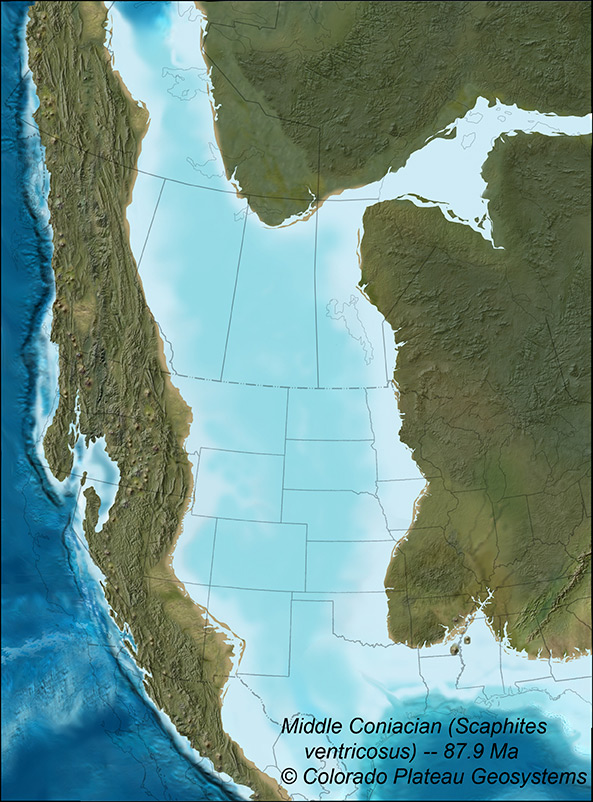
| UK Middle Coniacian (Scaphites ventricosus) | 87.9 Ma |
| UK Early Coniacian (Inoceramus erectus) | 89.0 Ma |
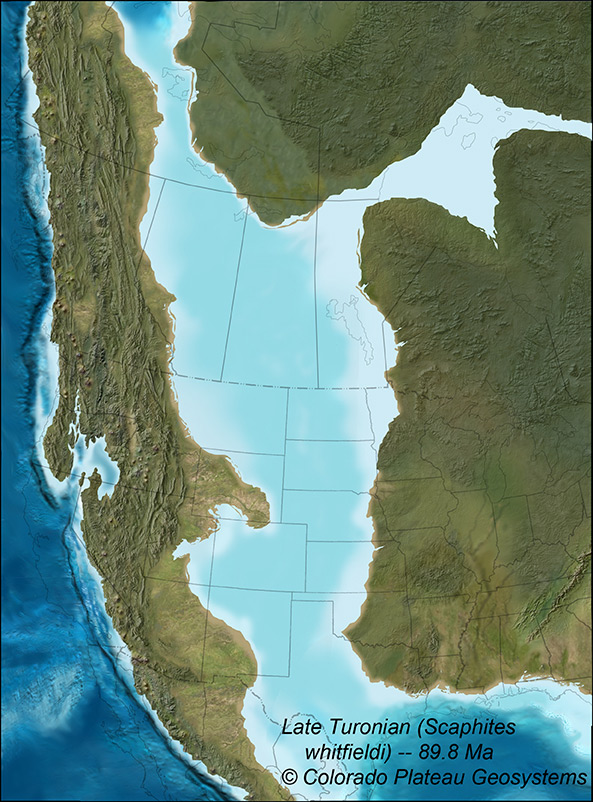
| UK Late Turonian (Scaphites whitfieldi) | 89.8 Ma |
| UK Late Turonian (P. wyomingensis-macombi) | 90.5 Ma |
| UK Middle Turonian (Prionocyclus hyatti) | 90.9 Ma |
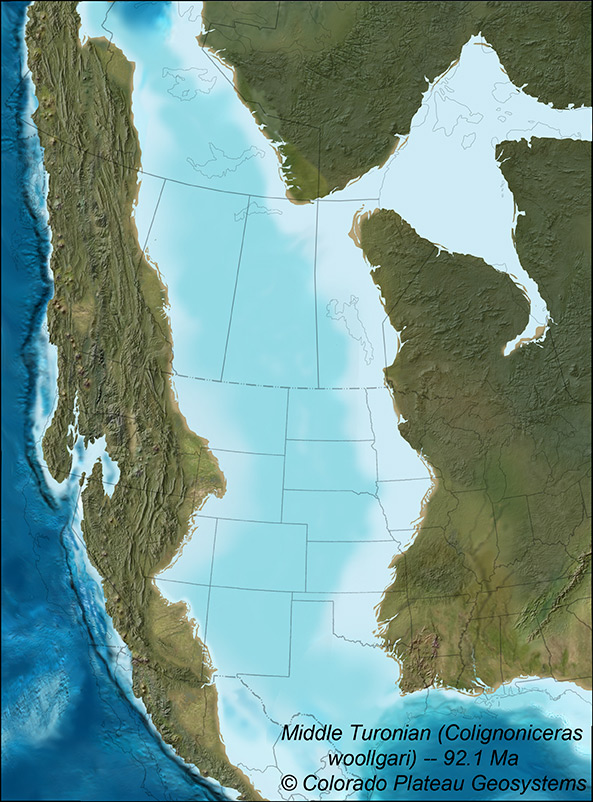
| UK Middle Turonian (Colignoniceras woollgari) | 92.1 Ma |
| UK Early Turonian (Watinoceras coloradoense) | 93.2 Ma |
| UK Late Cenomanian (Sciponocerus gracile) | 94.0 Ma |
| UK Late Cenomanian (M. mosbyense) | 94.3 Ma |
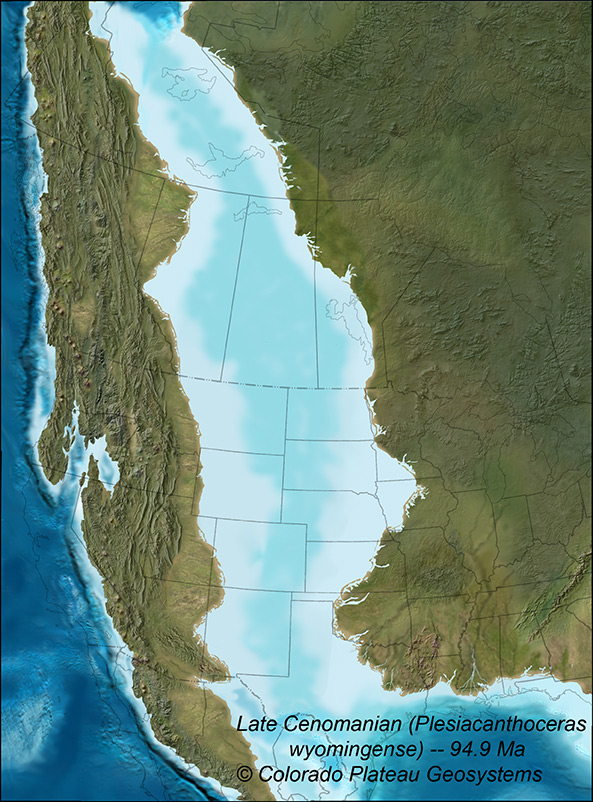
| UK Late Cenomanian (P. wyomingense) | 94.9 Ma |
| UK Middle Cenomanian (C. tarrantense) | 96.0 Ma |
| UK Early Cenomanian (N. americanus) | 98.1 Ma |
| UK Early Cenomanian (Mowry transgression) | 100 Ma |
| LK Late Albian (Muddy Low stand) | 101 Ma |
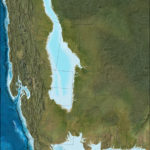
| LK Late Albian (Skull Creek high stand) | 105 Ma |
| LK Albian (Skull Creek transgression) | 106 Ma |
| LK Albian (Fall River high stand) | 110 Ma |
| LK Aptian/Albian (Fall River transgression) | 112 Ma |
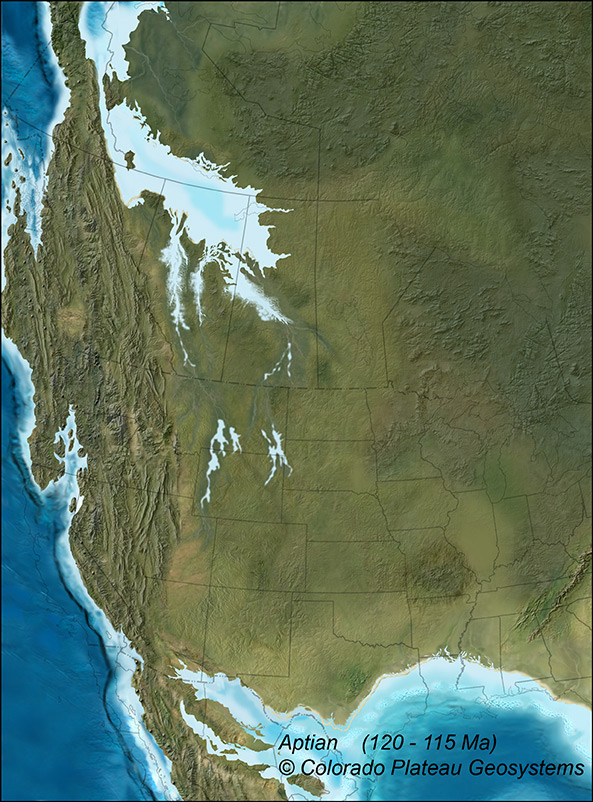
| LK Aptian (Fluvial, Cedar Mtn.-Cloverly) | 115 Ma |
| LK Aptian (Fluvial, Cedar Mtn.-Cloverly) | 120 Ma |
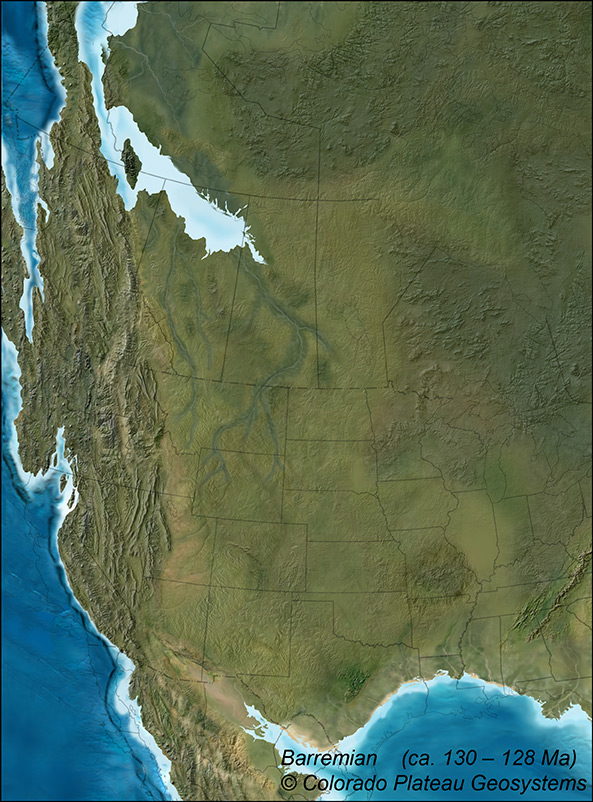
| LK Barremian (Fluvial, Cedar Mtn.-Cloverly) | 125 Ma |
| LK Hauterivian (Fluvial, Cedar Mtn.-Cloverly) | 130 Ma |
| LK Valanginian (Fluvial, Cedar Mtn.-Cloverly) | 136 Ma |
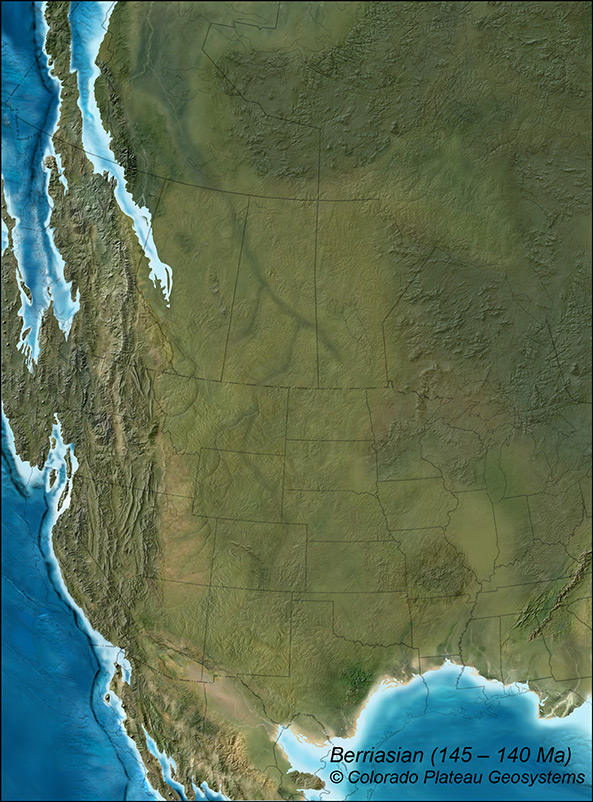
| LK Berriasian (Fluvial, valley cutting) | 140 Ma |
UK = Upper Cretaceous
LK = Lower Cretaceous
-
- Western Interior Seaway 65 Ma K-T Boundary
-
- Western Interior Seaway 69.7 Ma Maastrichtian
-
- Western Interior Seaway 70.4 Ma Campanian/Maastrichtian
-
- Western Interior Seaway 72.1 Ma Campanian (Late)
-
- Western Interior Seaway 80 Ma Campanian (Middle)
-
- Western Interior Seaway 82.9 Ma Campanian (Early)
-
- Western Interior Seaway 84 Ma Santonian (Late)
-
- Western Interior Seaway 87.9 Ma Coniacian (Middle)
-
- Western Interior Seaway 89.8 Ma Turonian (Late)
-
- Western Interior Seaway 92.1 Ma Turonian (Middle)
-
- Western Interior Seaway 94.9 Ma Cenomanian (Late)
-
- Western Interior Seaway 99 Ma Albian/Cenomian

-
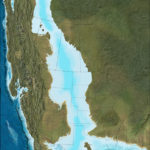
- Western Interior Seaway 105 Ma Albian (Late)
-
- Western Interior Seaway 120 Ma Aptian
-
- Western Interior Seaway 130 Ma Barremian
-
- Western Interior Seaway 145 Ma Berriasian
-
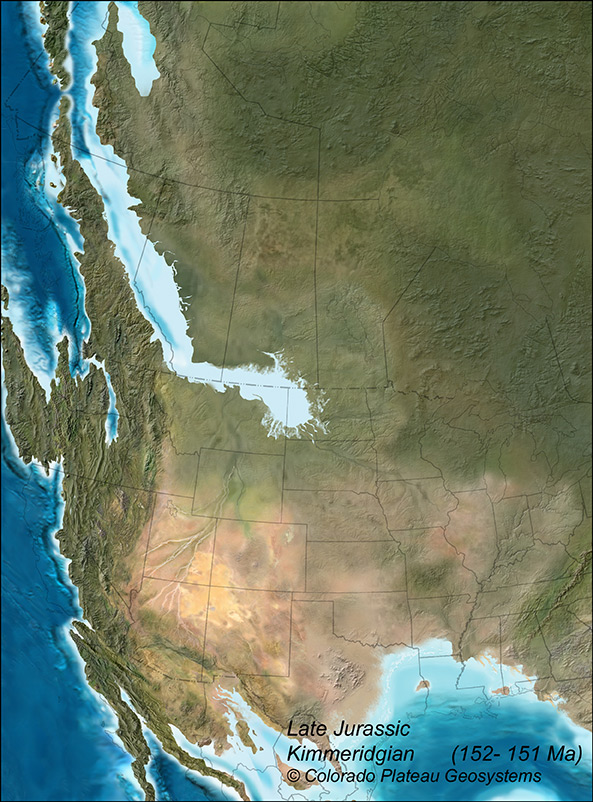
- Western Interior Seaway 152 Ma Jurassic (Late)
-
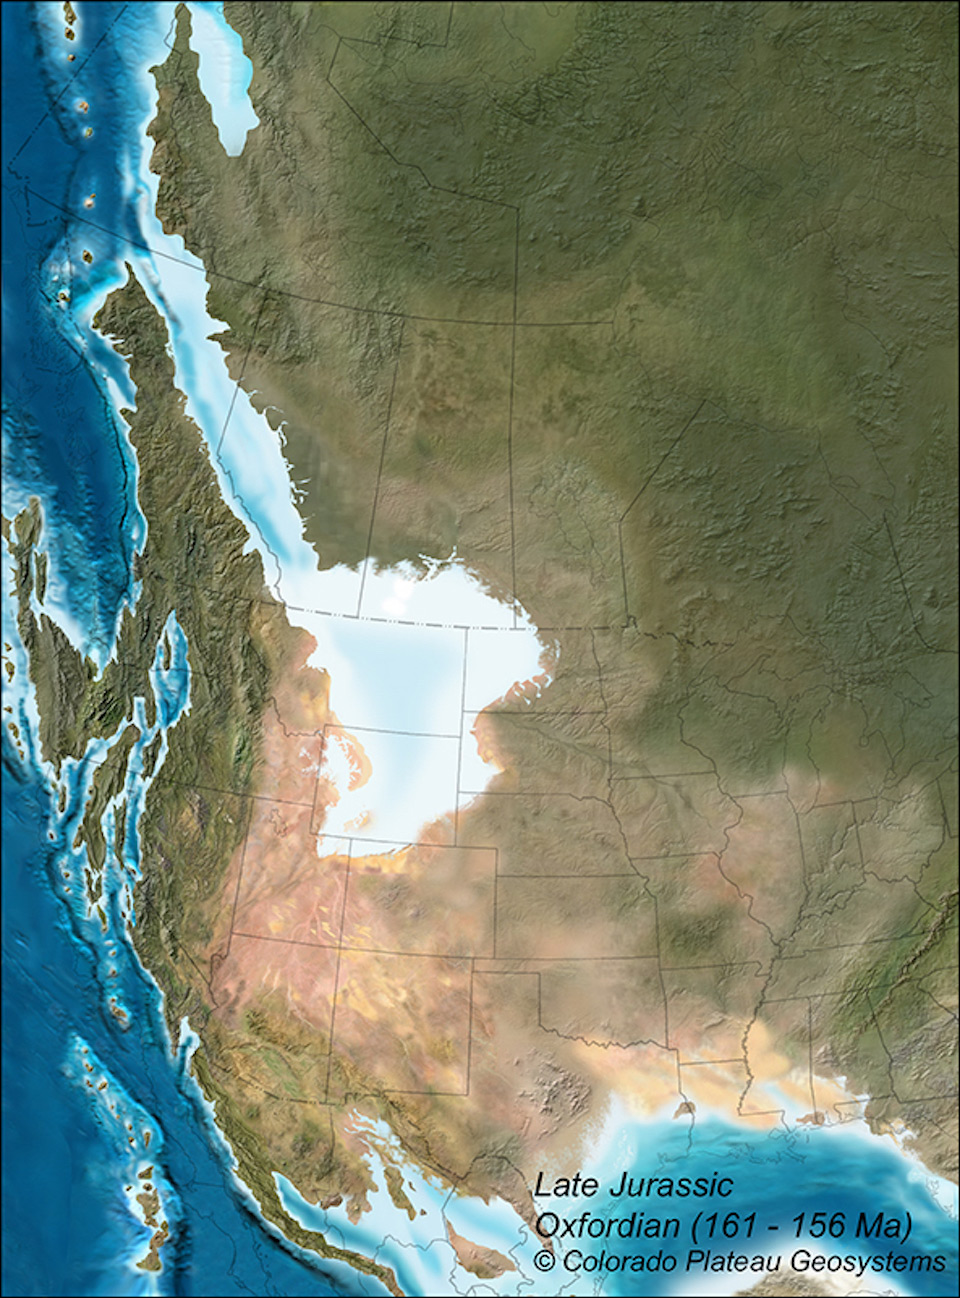
- Western Interior Seaway 161 Ma Jurassic (Late)
-
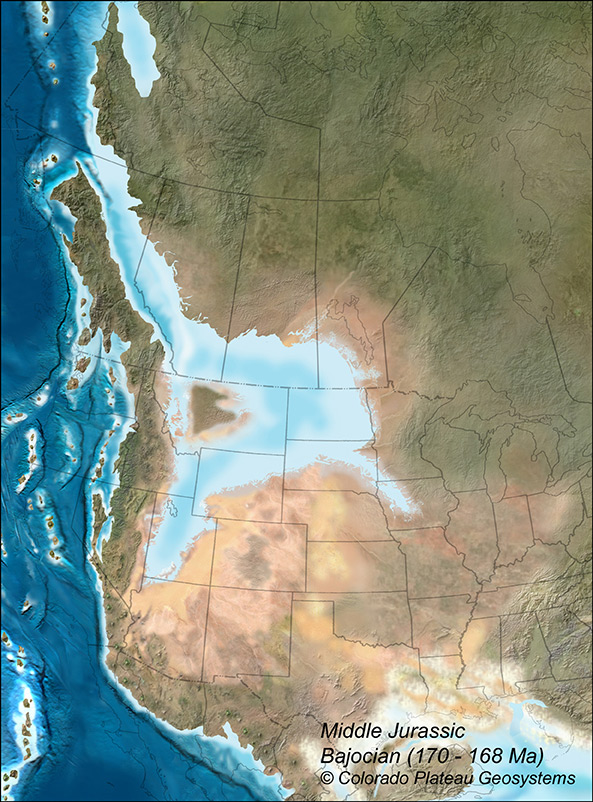
- Western Interior Seaway 170 Ma Jurassic (Middle)
-
- Western Interior Seaway 185 Ma Jurassic (Early)