Greater Permian Basin
22 Total Time Slices
| Triassic | |
|---|---|
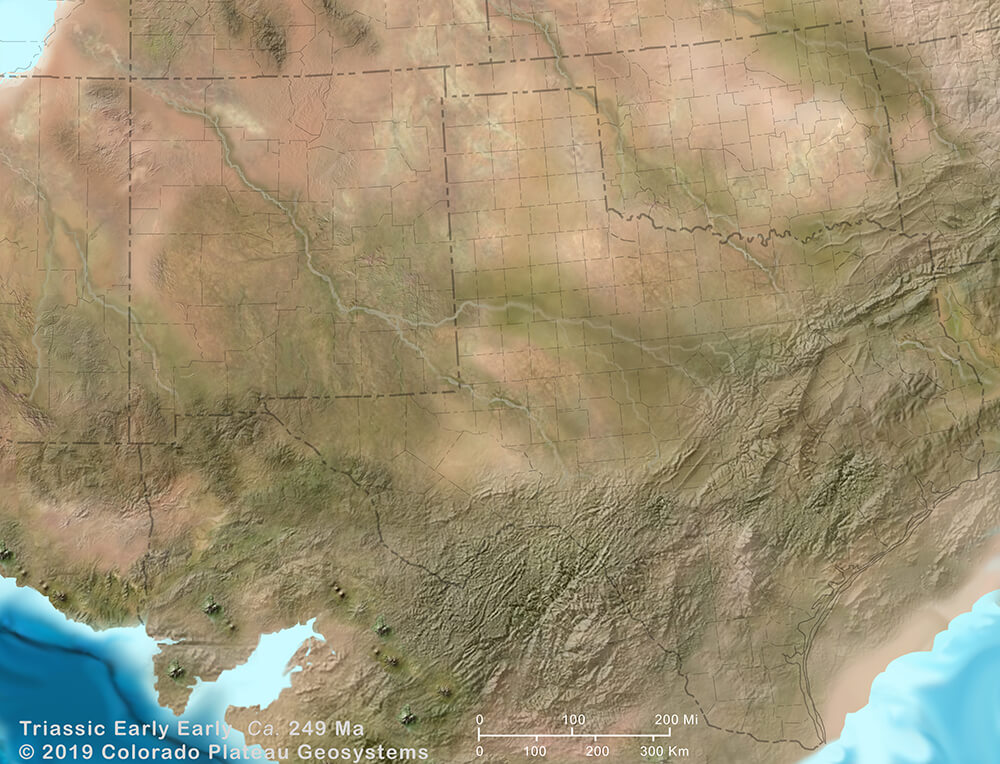
| Early | 245 Ma |
| Permian | |
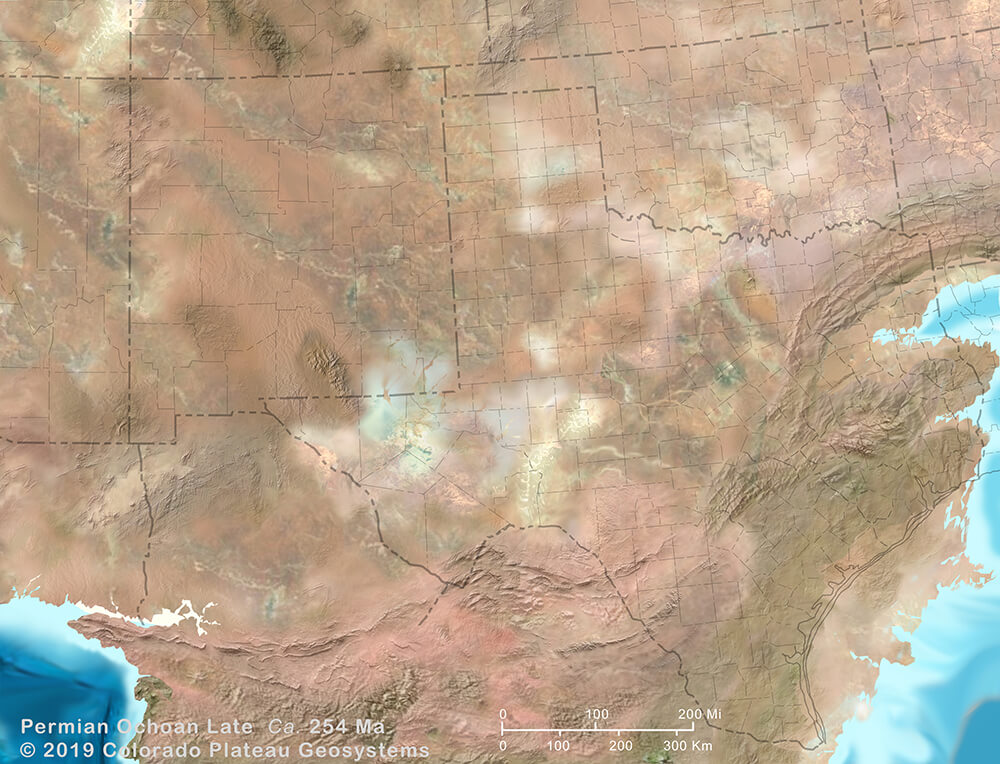
| Ochoan Rustler | 254 Ma |
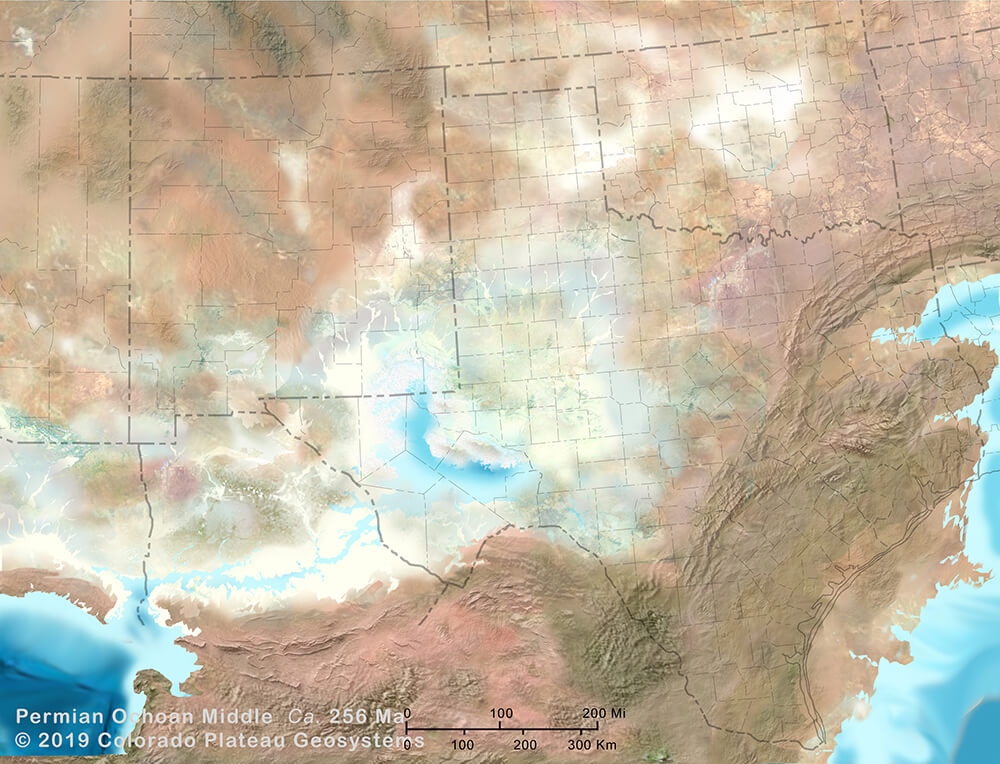
| Ochoan Salado | 256 Ma |
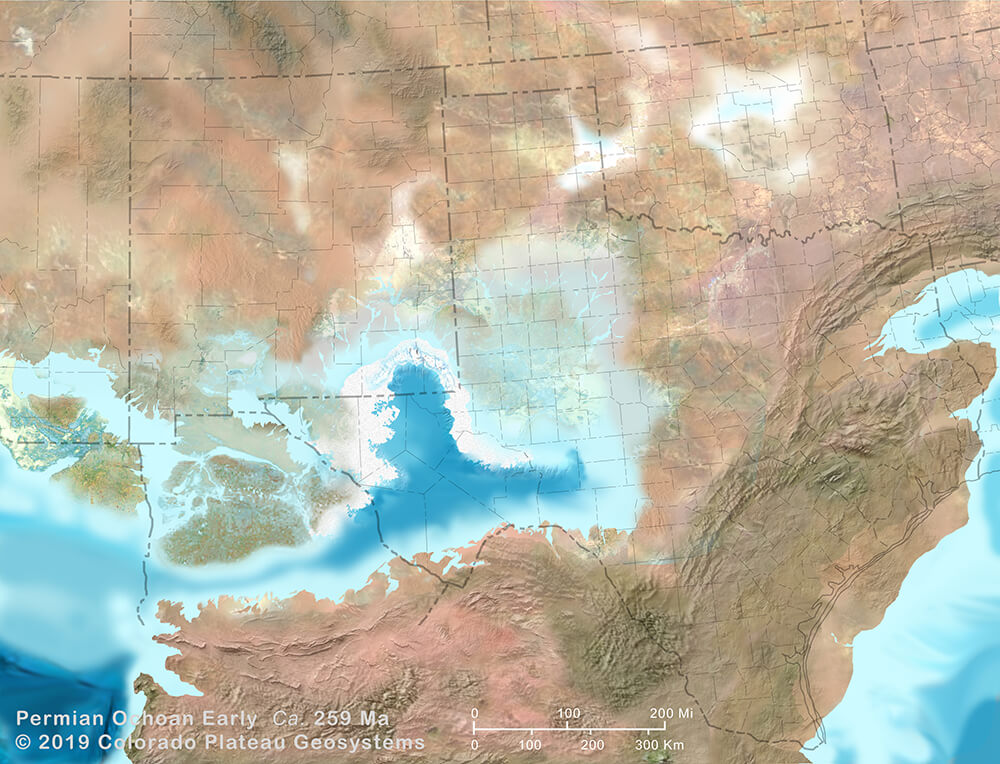
| Ochoan Castile | 259 Ma |
| Guadalupian Late | 263 Ma |
| Guadalupian Early | 268 Ma |
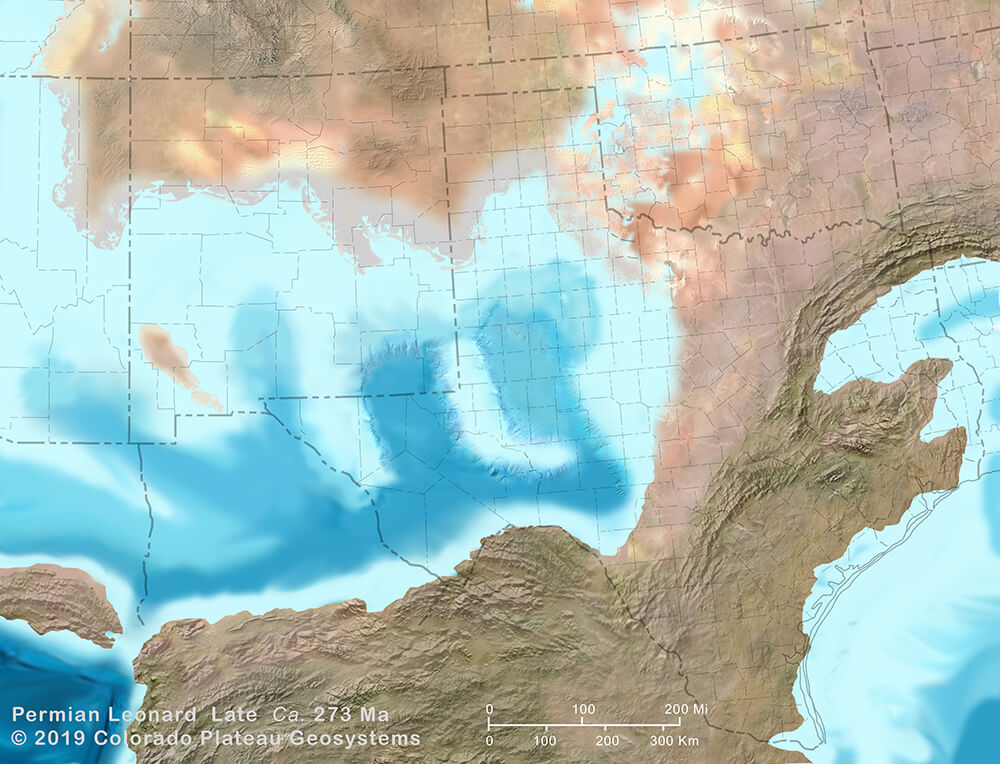
| Leonardian Late | 273 Ma |
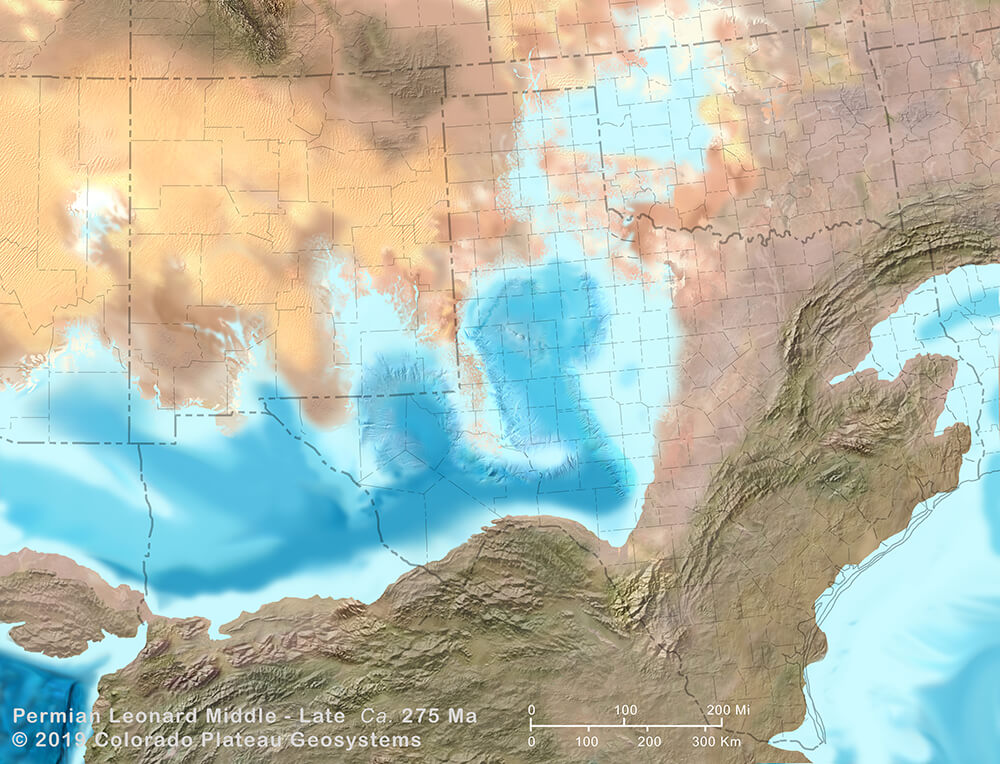
| Leonardian Middle-Late | 275 Ma |
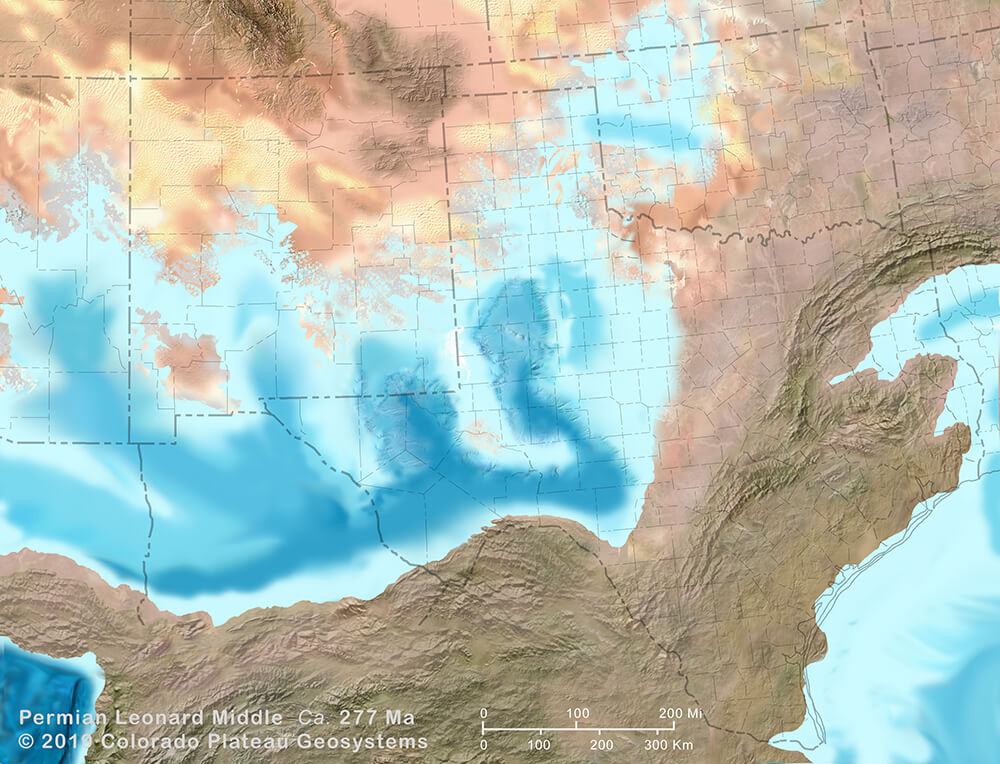
| Leonardian Middle | 277 Ma |
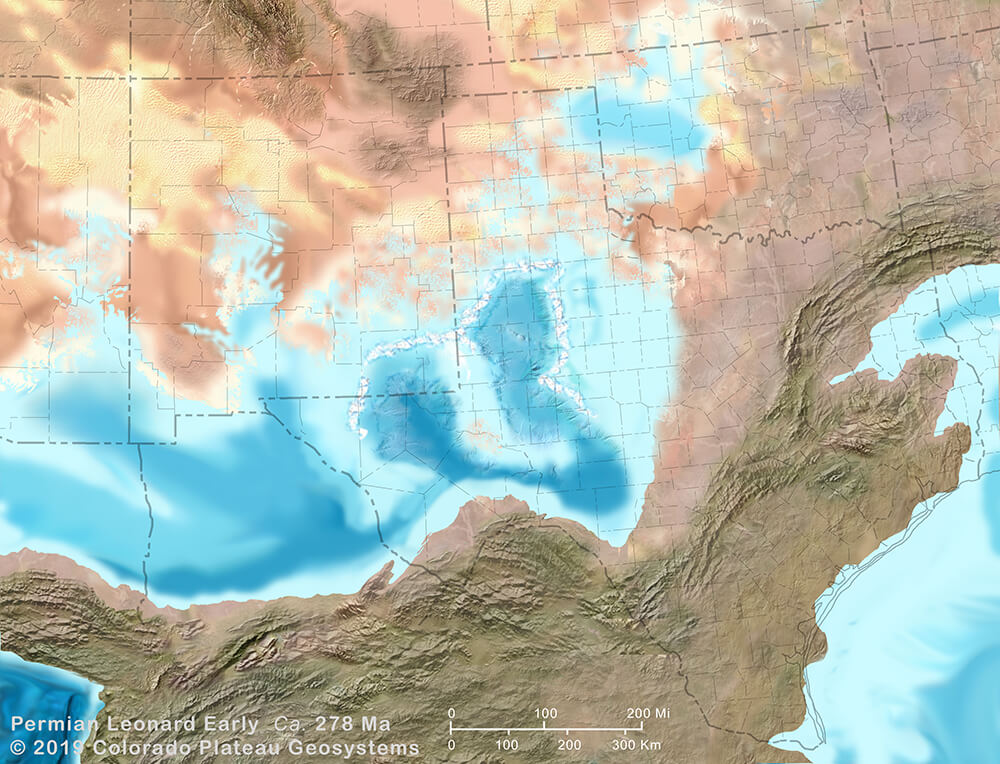
| Leonardian Early | 278 Ma |
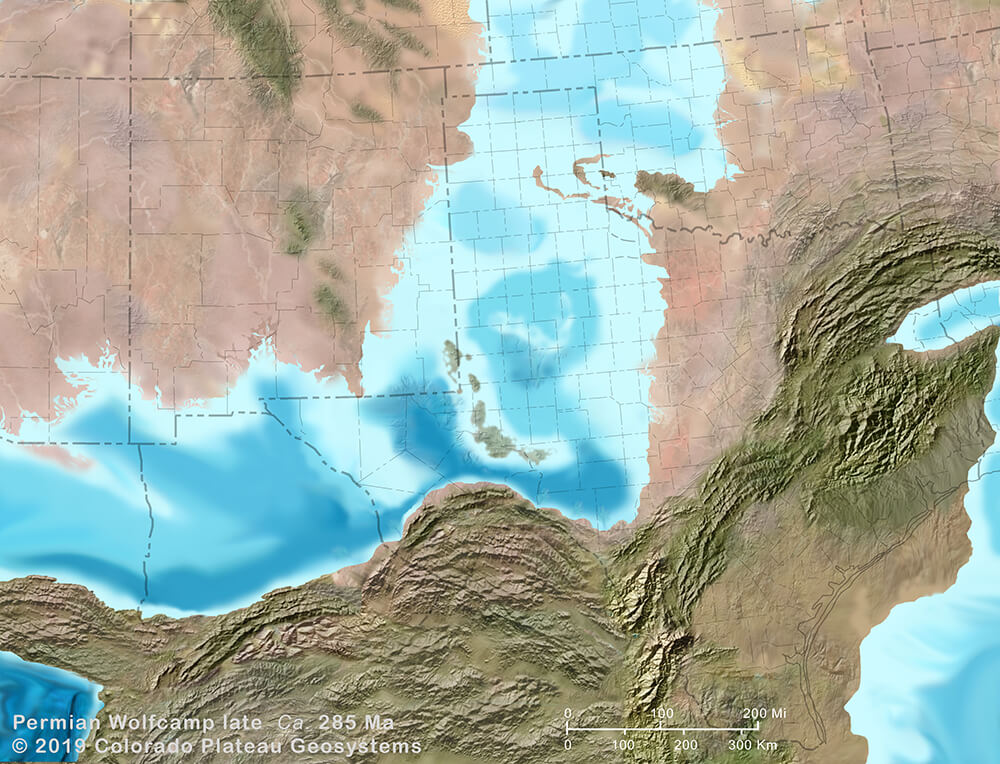
| Wolfcampian Late | 285 Ma |
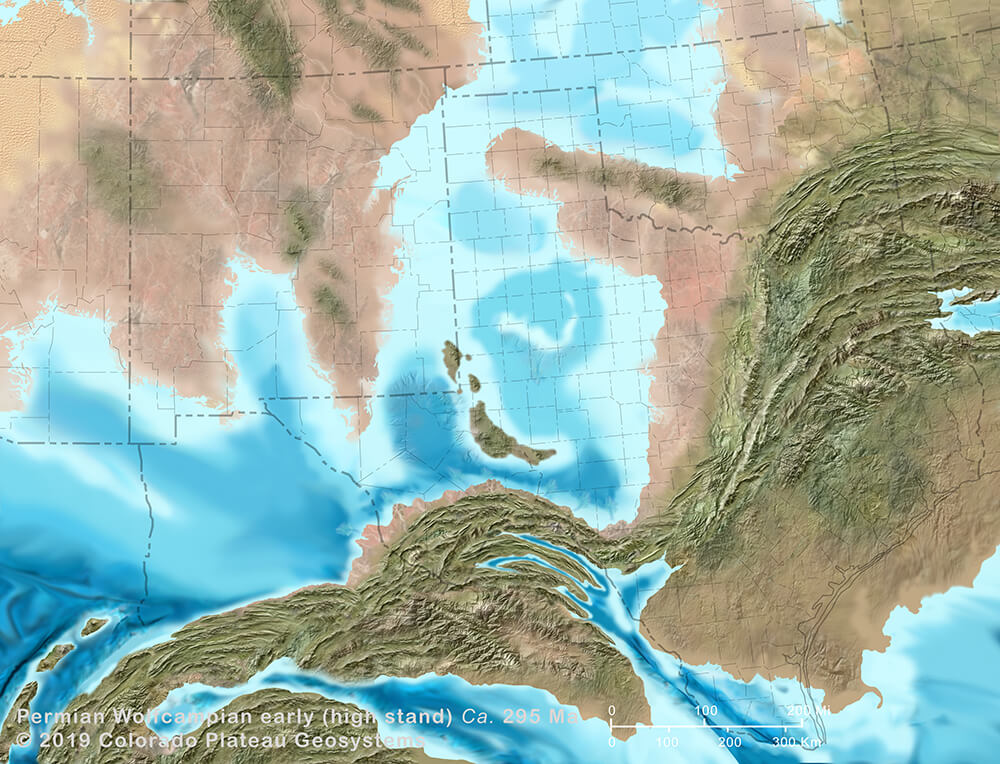
| Wolfcampian Early | 295 Ma |
| Pennsylvanian | |
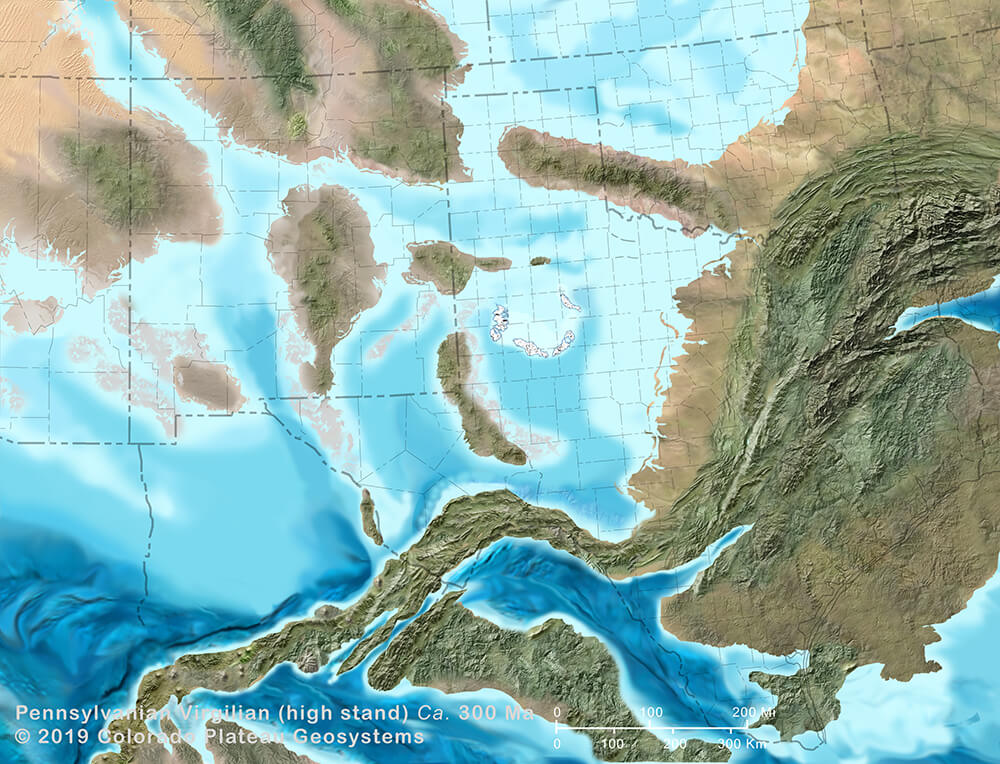
| Virgilian | 300 Ma |
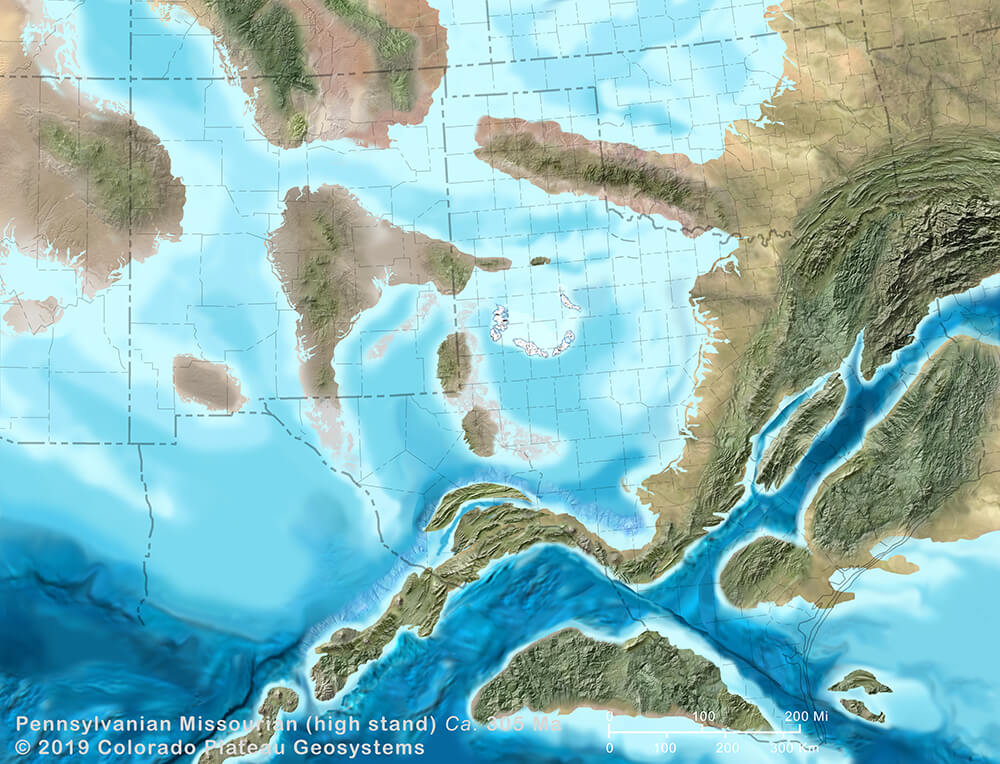
| Missourian | 305 Ma |
| DesMoinesian Late | 308 Ma |
| DesMoinesian Early | 312 Ma |
| Atokan Middle | 314 Ma |
| Atokan Early | 316 Ma |
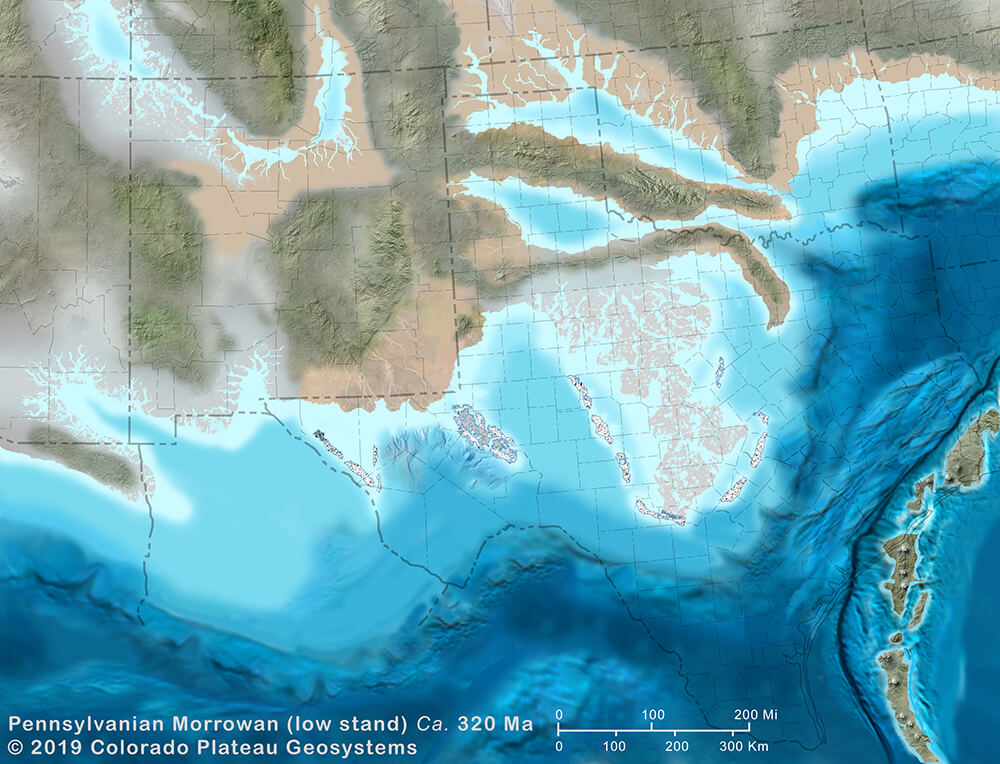
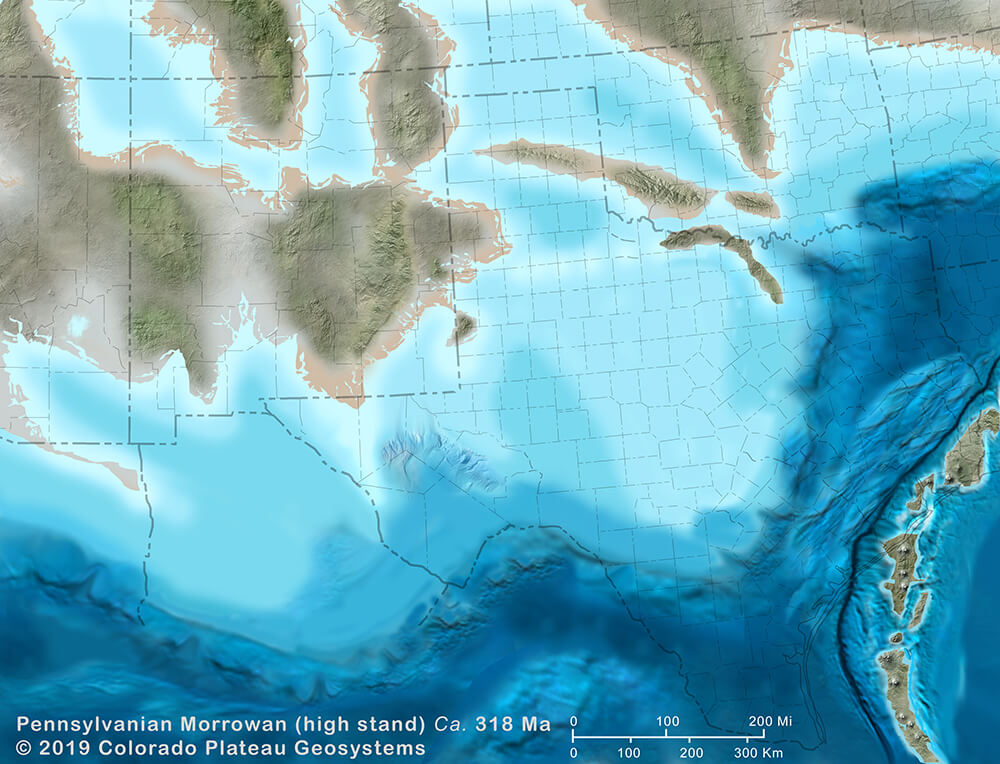
| Morrowan Late | 318 Ma |
| Morrowan Early | 320 Ma |
| Mississippian | |
| Chesterian | 325 Ma |
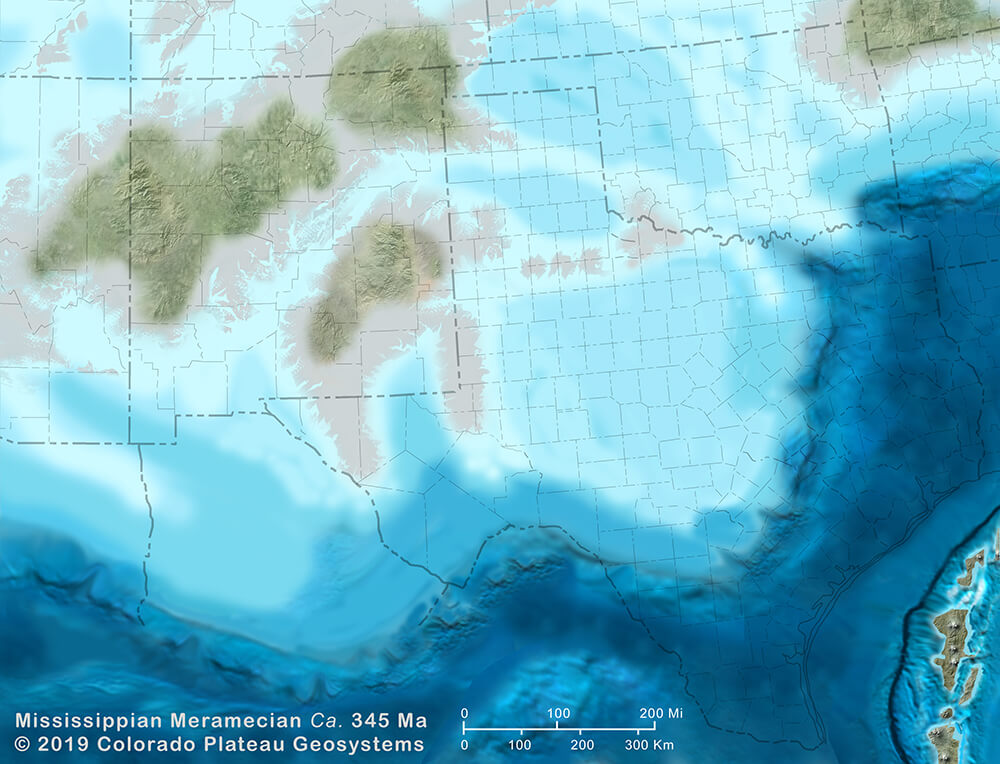
| Meramecian | 345 Ma |
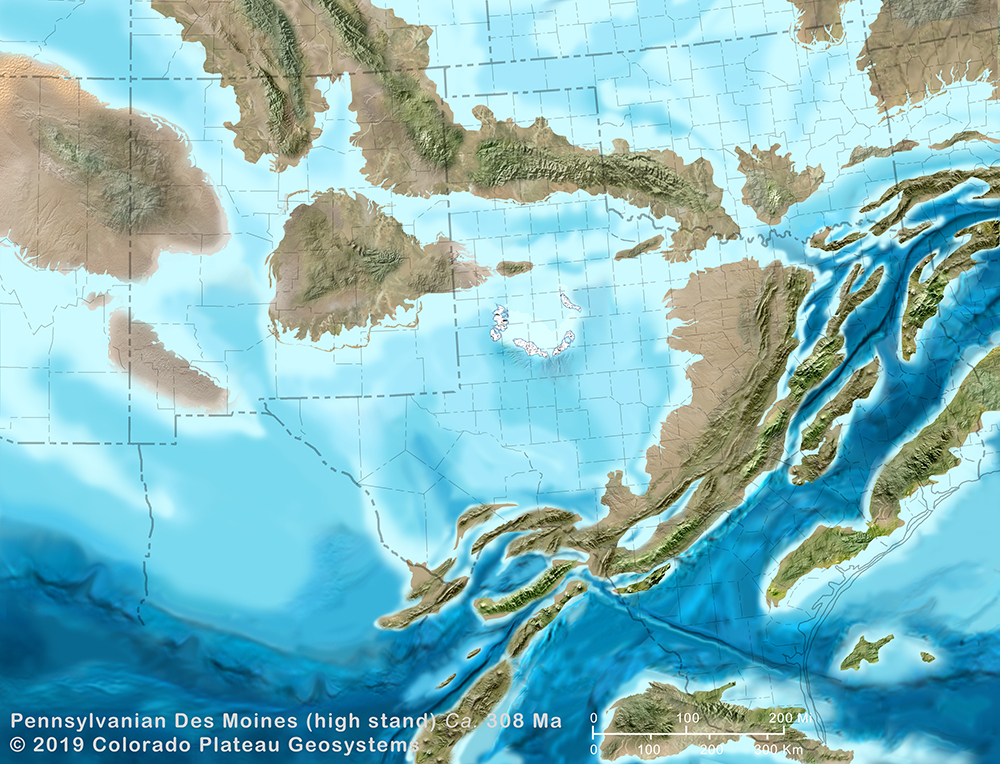
The Greater Permian Basin region was part of the early and middle Paleozoic Tobosa Basin but evolved into its distinct geometry and character during the Pennsylvanian and Permian. It was no longer a basin by the Early Triassic. The 22 time slices range from the Middle Mississippian to Early Triassic with 19 in the Pennsylvanian and Permian. Each time slice is named for the time-stratigraphic interval that it shows (eg. Early Atokan, Late Guadalupian) with its approximate absolute time shown in the title. The rocks deposited during the numerous marine transgressions and regressions in both continental and marine environments contain vast deposits of hydrocarbons that make the region one of the worlds’ top 10 oil-producing regions.
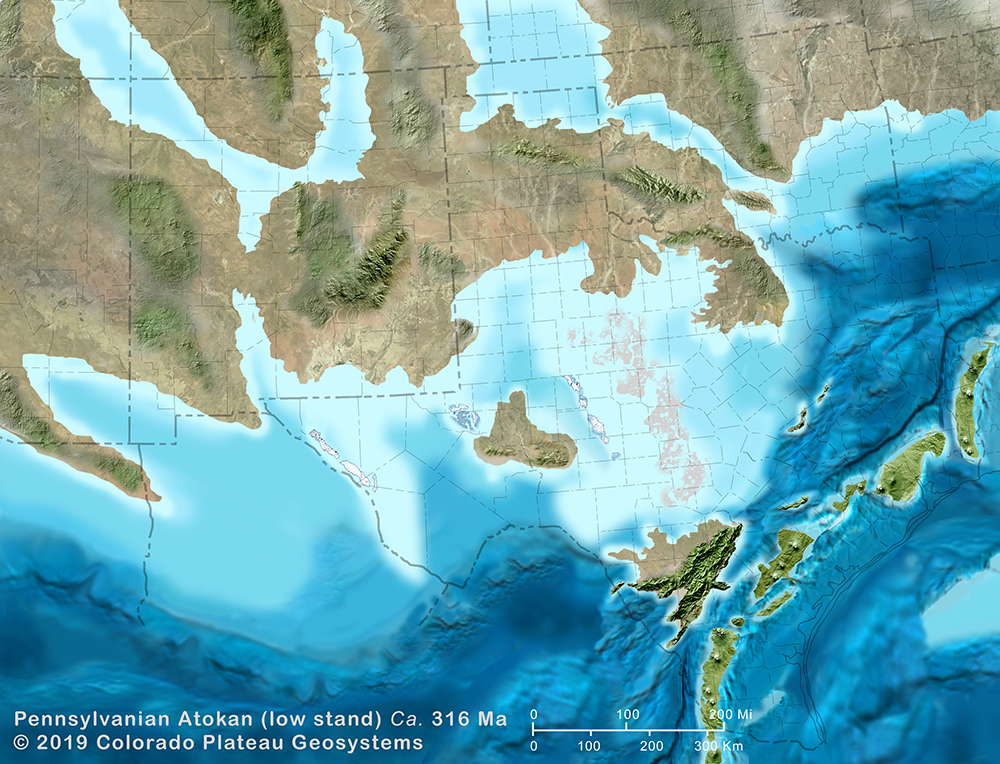
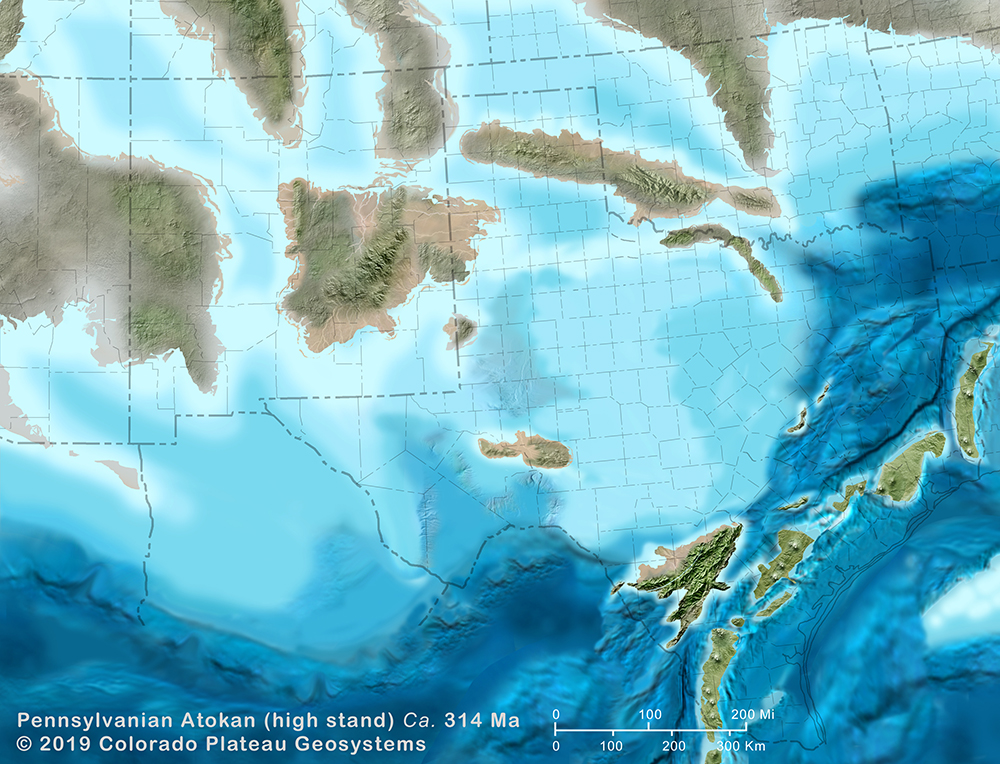
Although the states of Texas, New Mexico, and Oklahoma form the centerpiece of the maps, the boundaries extend into eastern Arizona, SE Utah, southern Colorado, southern Kansas, SW Missouri, western Arkansas, western Louisiana and northern Mexico. Today this region includes parts of the Colorado Plateau, Southern Rocky Mountains, Basin and Range-Rio Grande Rift, High Plains, Gulf Coast Plain, Ozarks, and Mississippi River lowlands. During the Pennsylvanian and Permian, most of the region was within the Greater Ancestral Rocky Mountains region (GARM) and the tectonics of the Permian Basin are thought by many geologists to be directly related to GARM tectonic events as well as the tectonics of the adjacent Ouachita-Marathon orogen. It was during GARM events that the geometry of the Greater Permian Basin (GPB) was established with the Diablo and Central Basin platforms separating the Marfa, Delaware, and Midland basins; the Hovey Channel and Valverde Basin formed at the margin of the Ouachita-Marathon foldbelt. In general, the basins had anoxic floors and deposition occurred as suspension, gravity, and turbidity deposits below wave base while the adjacent shelves and platforms were the sites of sand, mud, and especially carbonate deposition, mostly above wave base in both marine and continental environments. Superimposed on this general depositional system were repeated glacial-eustatic sea level changes of tens to more than a hundred meters of fluctuation. Significant facies migrations occurred in response to these changes. The various maps in the series show the results of these fluctuations.
These maps are at the same scale as the Southwestern North America series with which they overlap. However, the GPB series has been updated in some of the areas of overlap so not all of the maps match perfectly between the two series. Each time slice is accompanied by generalized sedimentary facies maps and stratigraphic names are shown for each map. A reference list of the key literature used in constructing the maps is available. Paleogeography along the eastern and southern margins of the maps behind the Ouachita-Marathon thrust belt is extremely hypothetical. Paleogeography and facies patterns are shown across some areas where subsequent erosion has removed broad areas of previously deposited rocks – these areas are marked by heavy black lines on the facies maps and features shown outside these lines are also hypothetical.
Correlation of stratigraphic units and the establishment of the time slices is based on the geologic literature. It should be pointed out that there exists some disagreement with some correlation and the use of stratigraphic nomenclature; some compromise was used on some maps. The absolute ages on each map were derived by correlating the time-stratigraphic units to the 2018 Geologic Time Scale (www.stratigraphy.org). On most maps, the date given should be considered to be accurate within +/- 1-2 million years. The caveat that applies to all paleogeographic maps is that the maps show what the region might have looked like – not what it did look like.
Water depths, suggested by shades of blue, are qualitative, not quantitative. Very pale shades suggest deposition above wave base with water depths 0-50 m (0-150 feet). Deepest waters were towards basin centers as those are the area of maximum subsidence; sedimentary facies suggest deepwater sedimentation. During rapid sea level rises, sediment was trapped near shore so water depths were likely greatest then. Maximum water depths may have been greater than 200 m (600+ feet) in the GPB.
Additional Notes:
- Maps are rasterized pixel images and are not shape files (nor are they based on shape files)
- Peleogeographic and paleotectonic elements (thrust belts, volcanic centers, paleo-shorelines, dune fields, basin geometry, facies maps, etc.) are plotted from the geologic literature and redrawn, repositioned, or reprojected on the base maps for the given time slices. This information is then used to construct the paleogeography.
- Paleogeography is cloned or painted using Photoshop®; cloned images are mostly from GeoMapApp, a marine geoscience, global topography data system (http://www.geomapapp.org/).
- Cloned modern Earth DEM images from GeoMapApp are selected as modern analogues to the paleo-features they are chosen to represent; most DEM images have been re-colored, resized, and/or re-shaped in Photoshop® .
- All map elements, both internal to North America and fringing or exotic, are palinspastically restored to each given time slice using recent data from literature.
- Paleoclimate patterns, shown via hues of greens vs browns and tans, are generalized.
Mississippian Maps
-
- Meramecian
-
- Chesterian

Pennsylvanian Maps
-
- Morrowan lowstand
-
- Morrowan highstand
-
- Atokan lowstand
-
- Atokan highstand
-
- Desmoinesian lowstand

-
- Desmoinesian highstand
-
- Missourian
-
- Virgillian
Permian Maps
-
- Wolfcamp Early
-
- Wolfcamp Late
-
- Leonardian Early
-
- Leonardian Middle
-
- Leonardian Middle-Late
-
- Leonardian Late
-
- Guadalupian Early

-
- Guadalupian Late

-
- Ochoan Early
-
- Ochoan Middle
-
- Ochoan Late
Triassic Map
-
- Early Triassic