Global Paleogeography and Tectonics in Deep Time
- Global Paleogeography and Tectonics in Deep Time
- Global Paleogeography and Tectonics in Deep Time Series
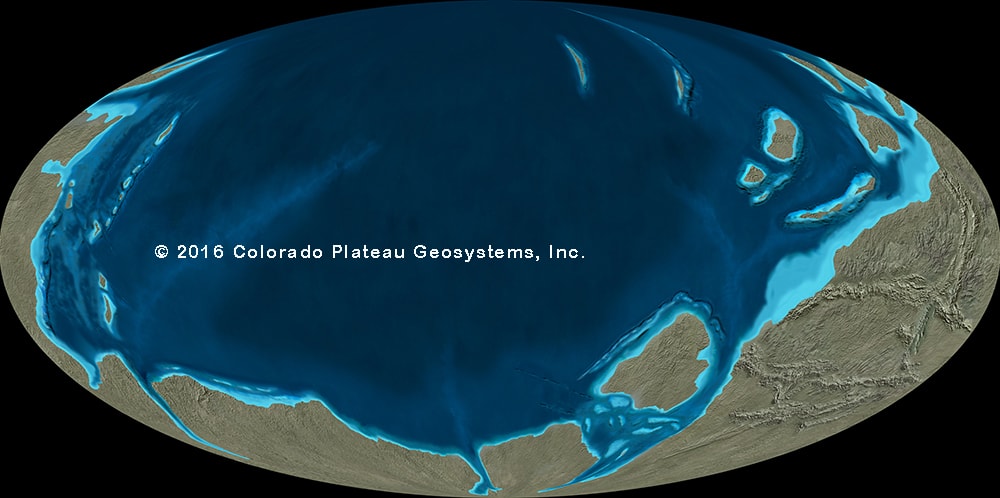
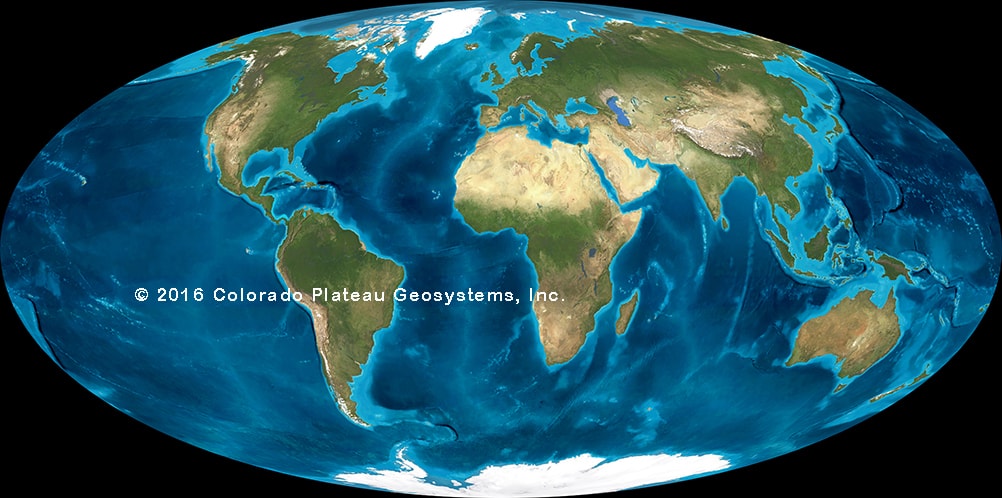
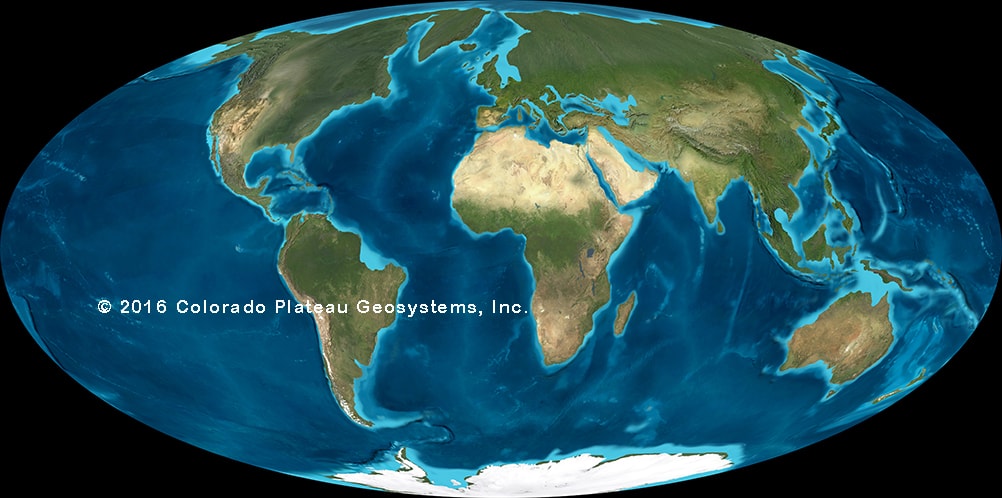
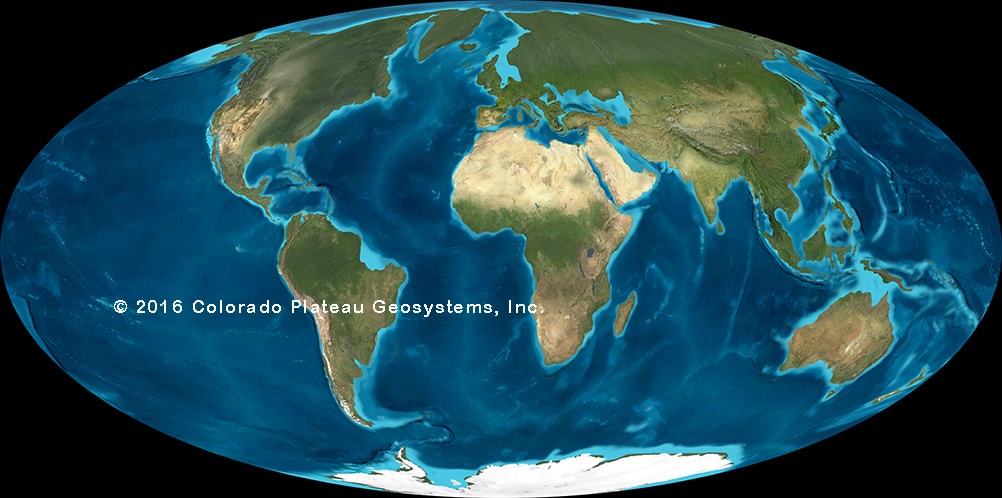
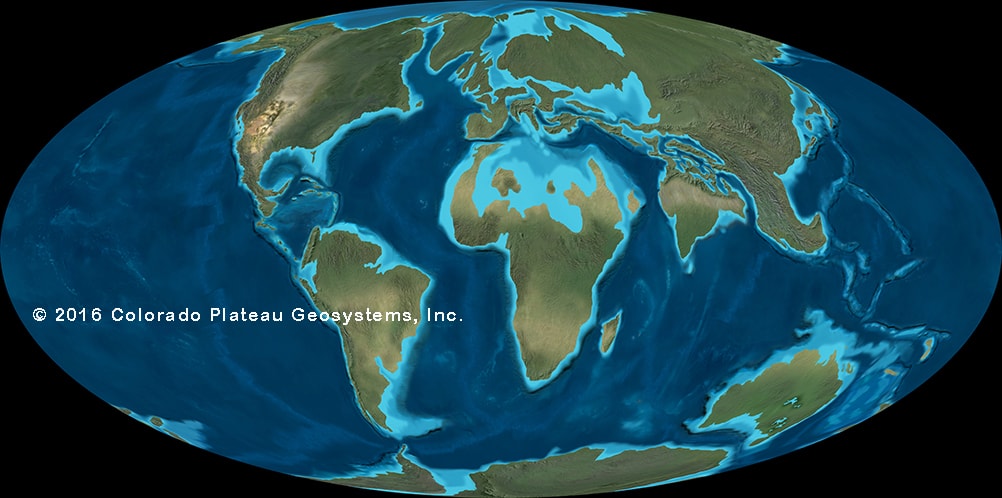
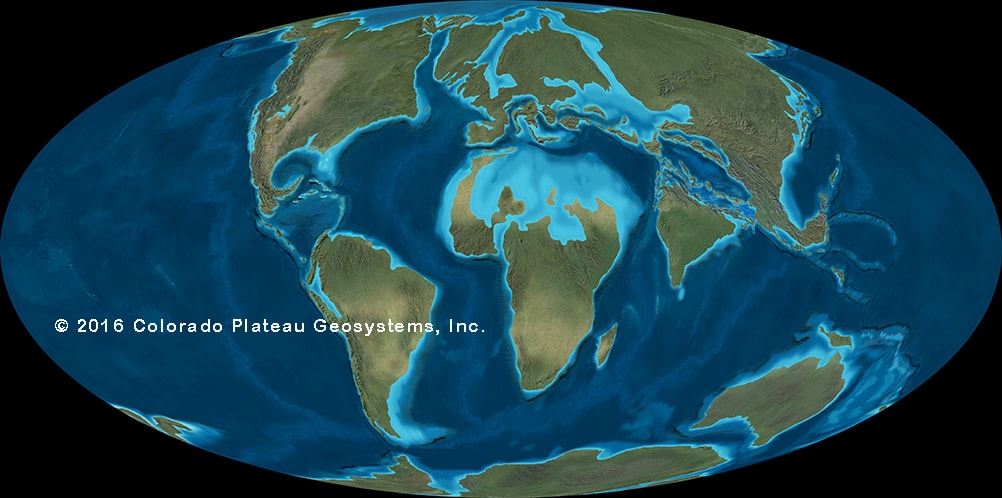
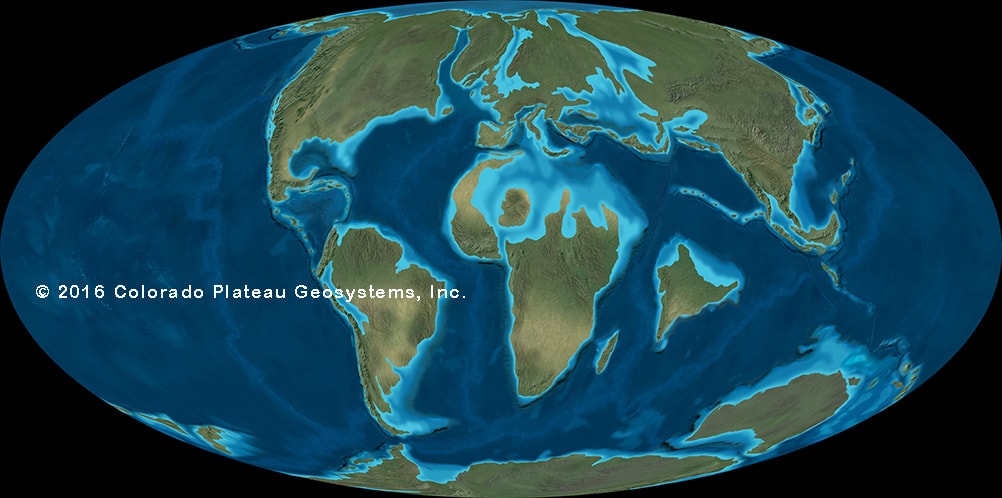
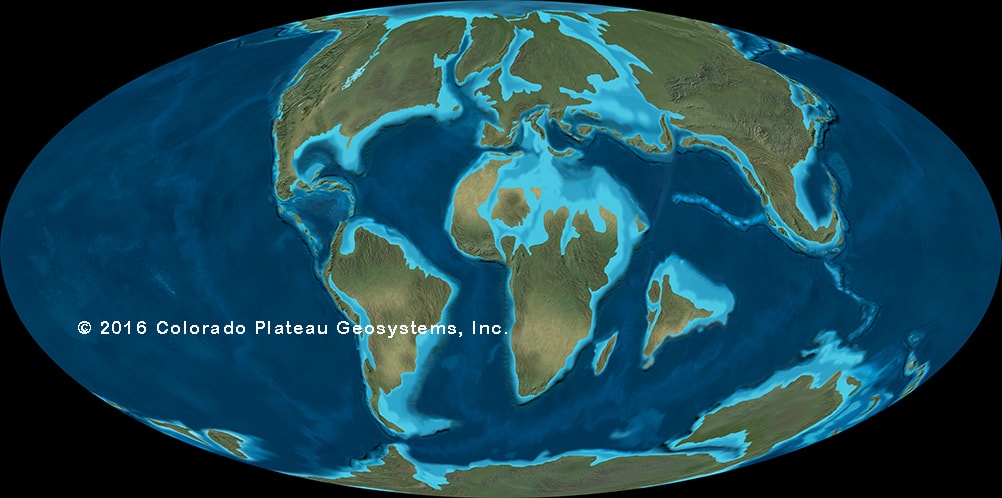
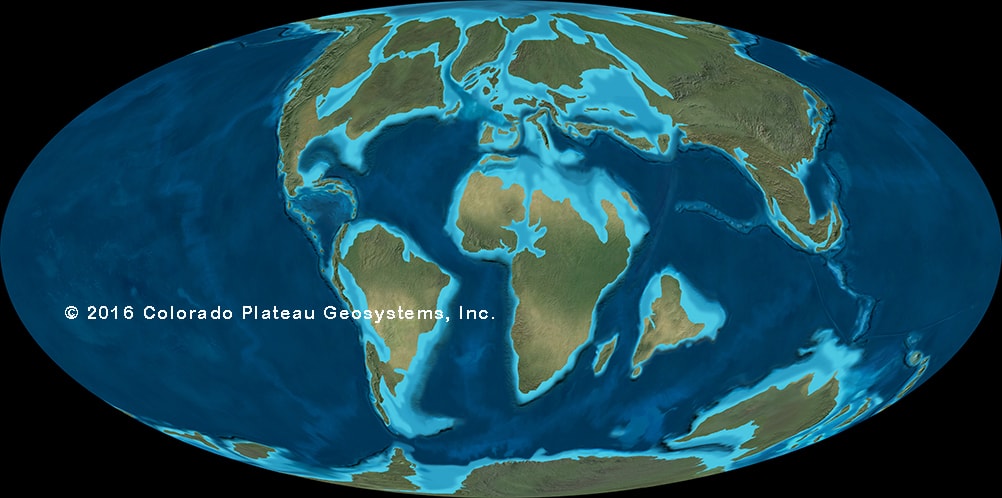
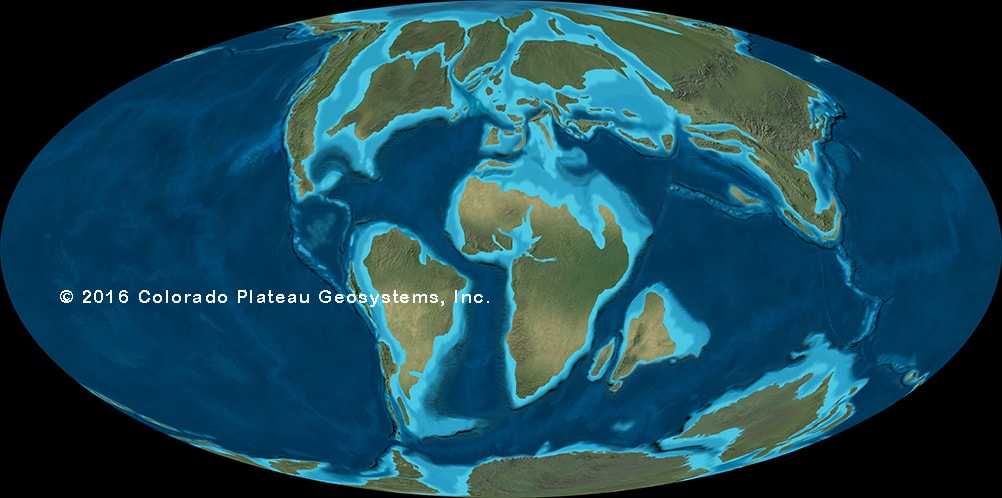
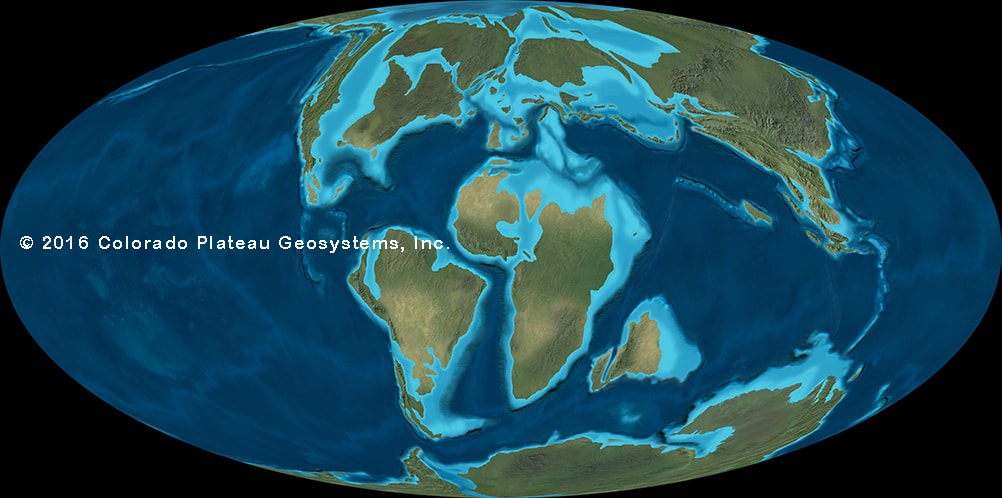
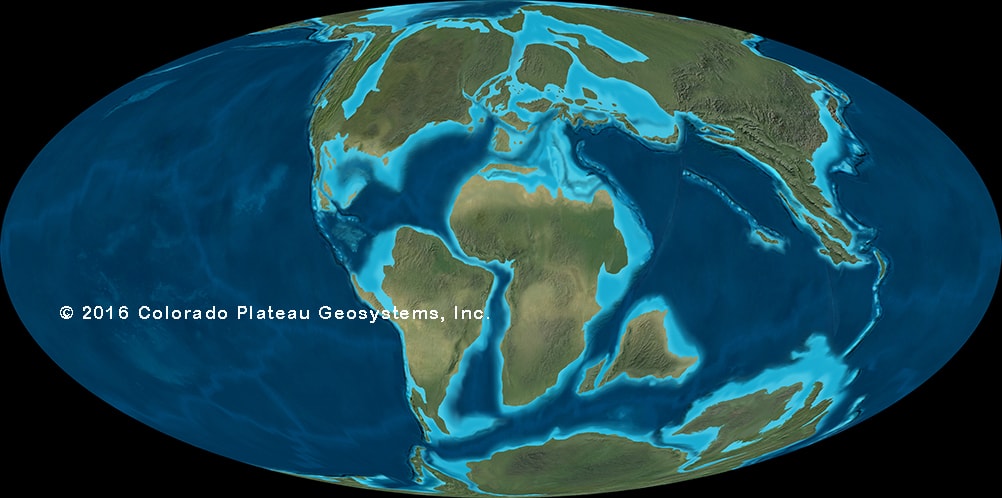
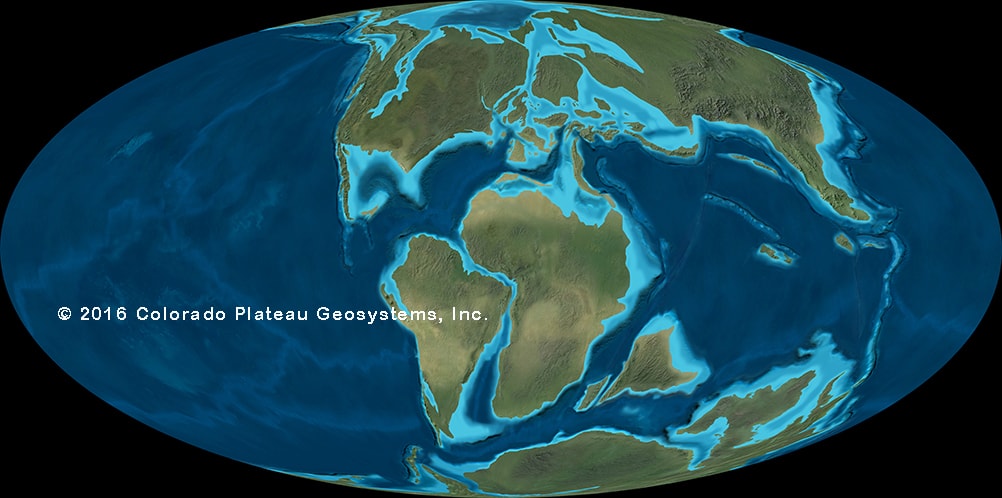
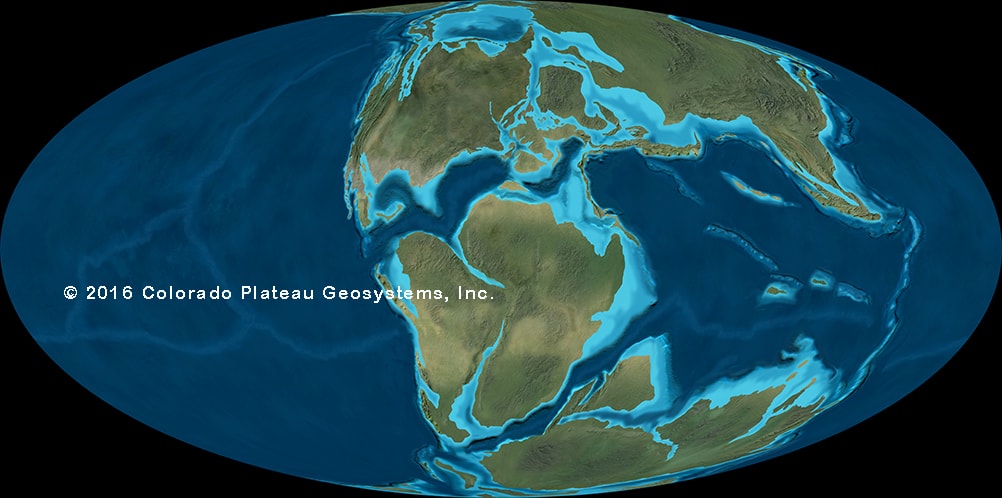
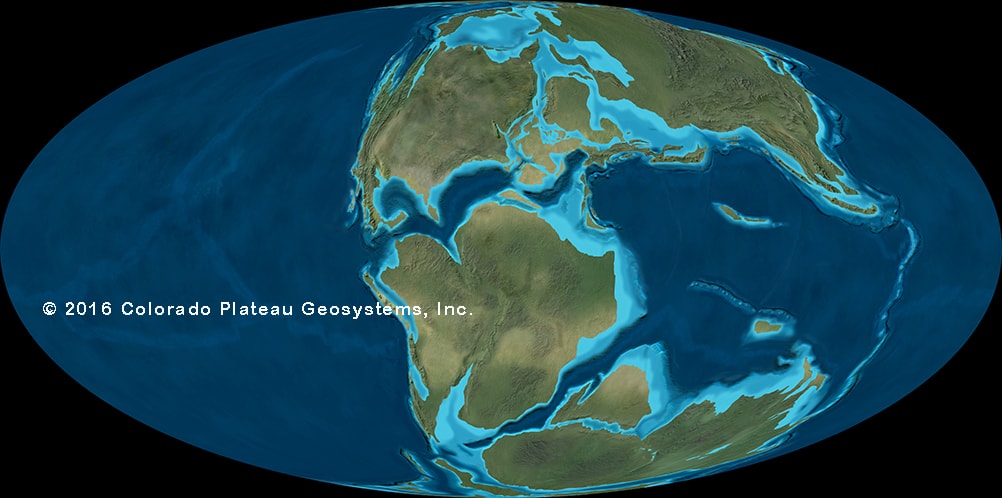
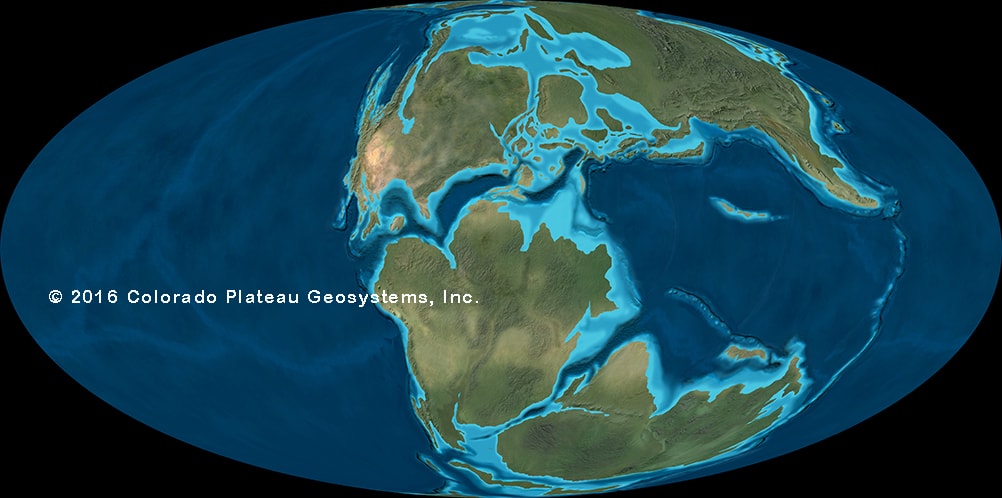
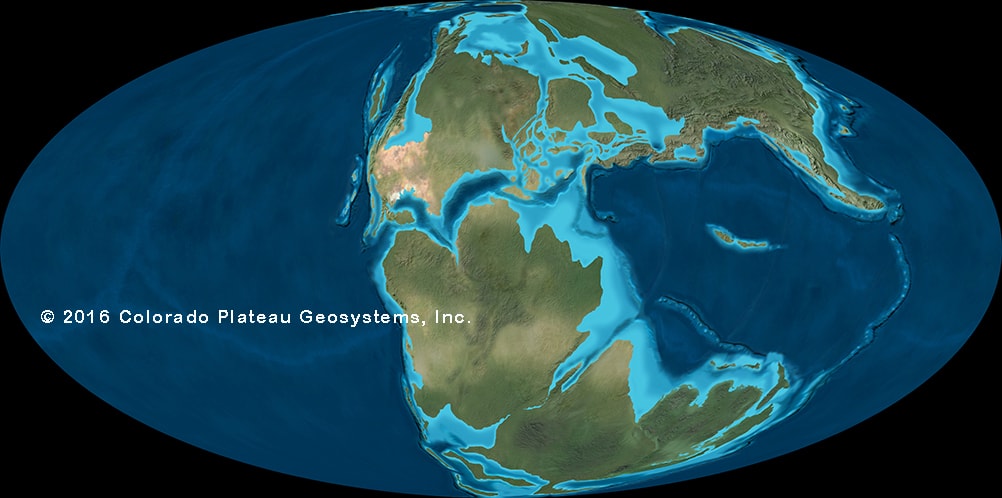
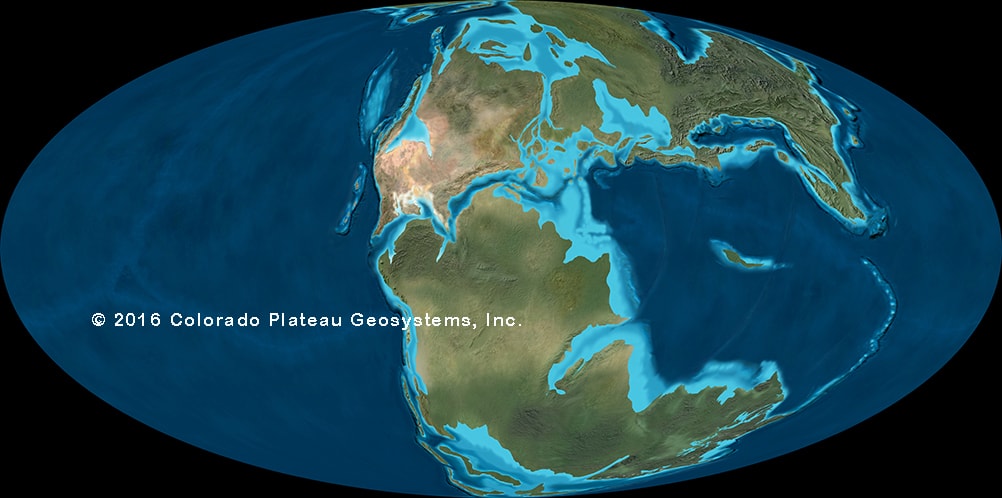
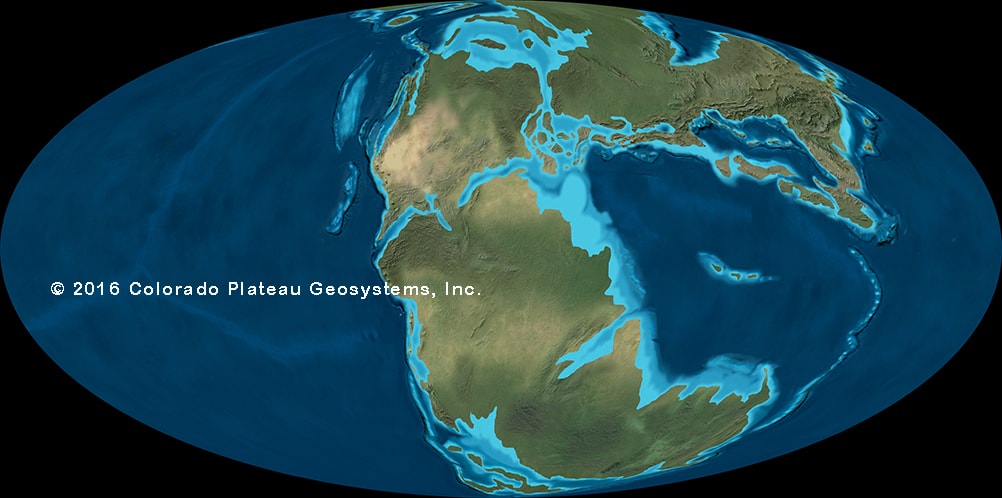
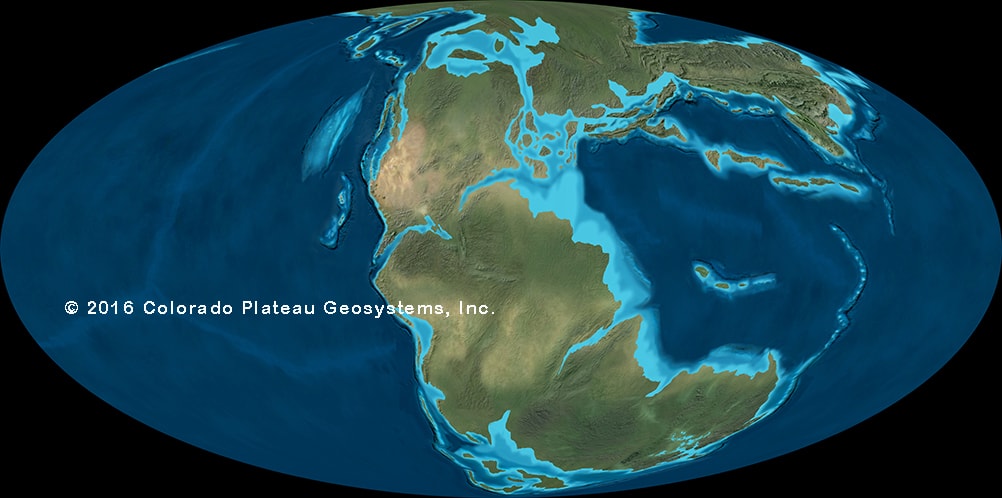
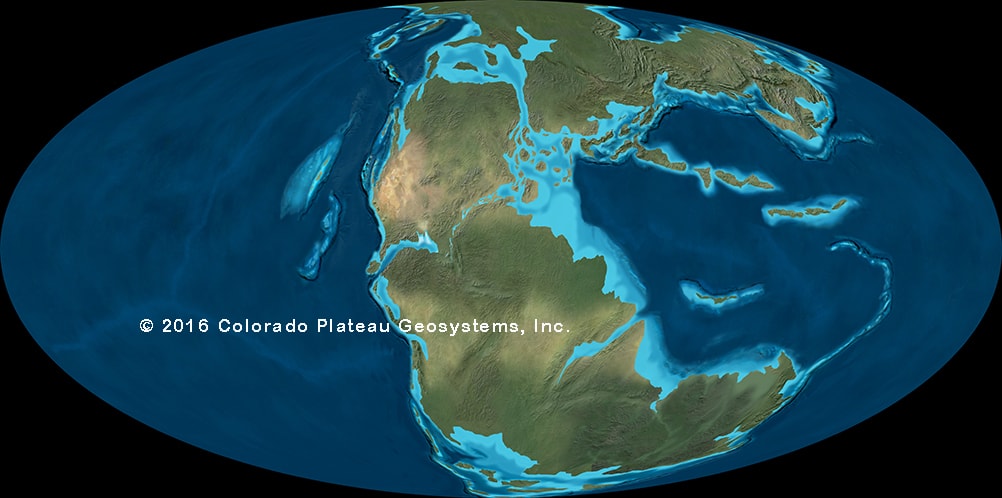
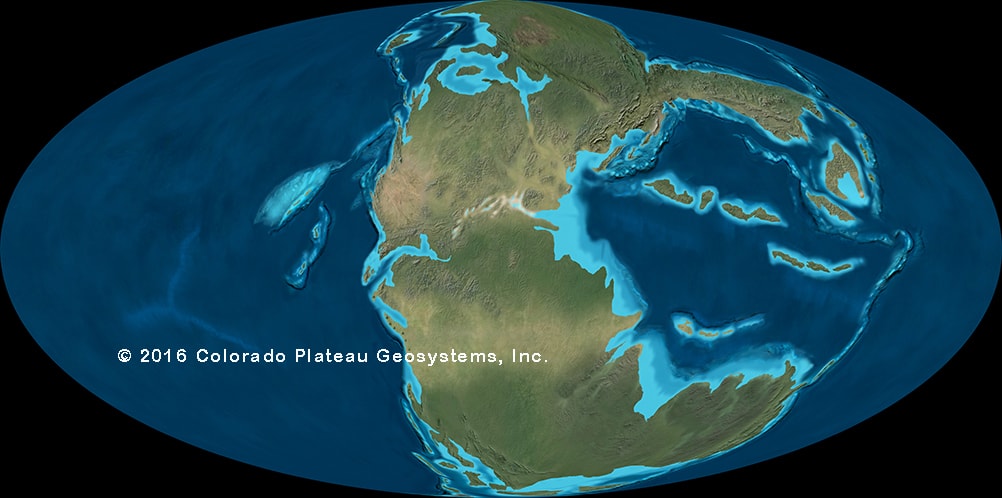
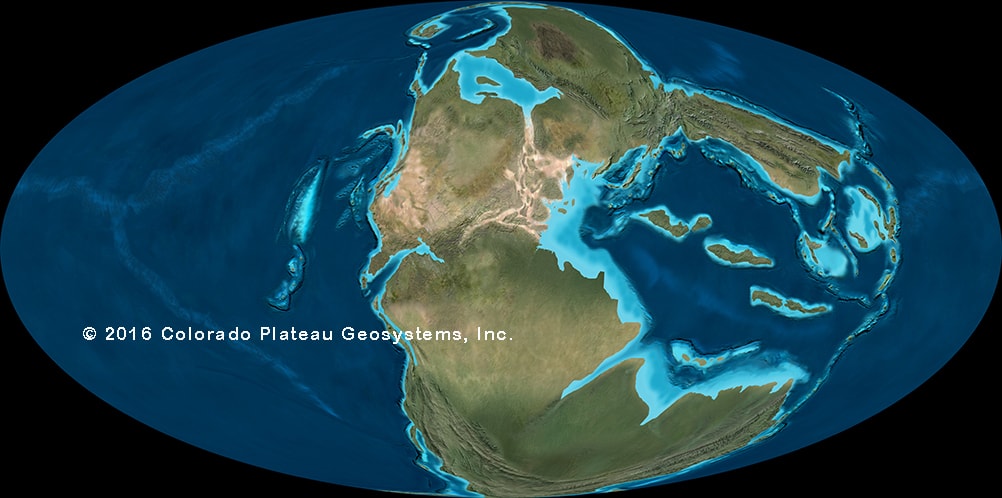
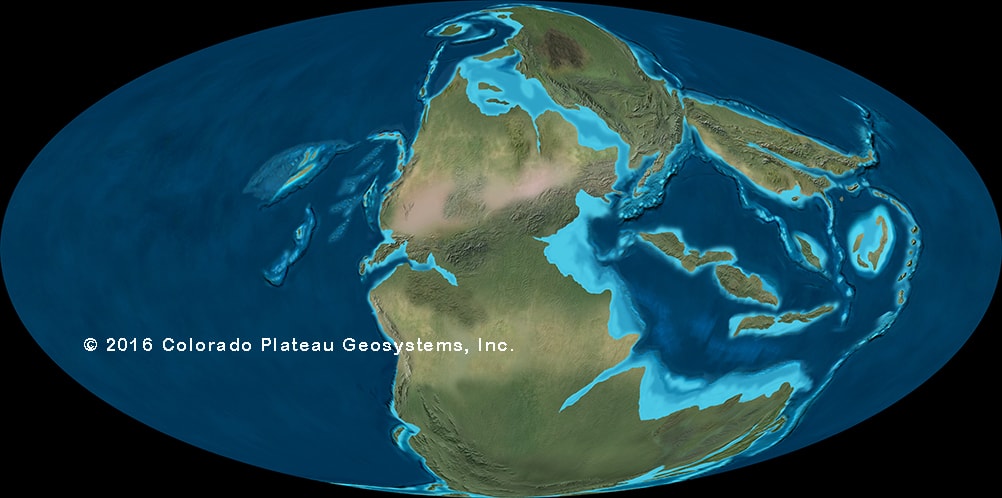
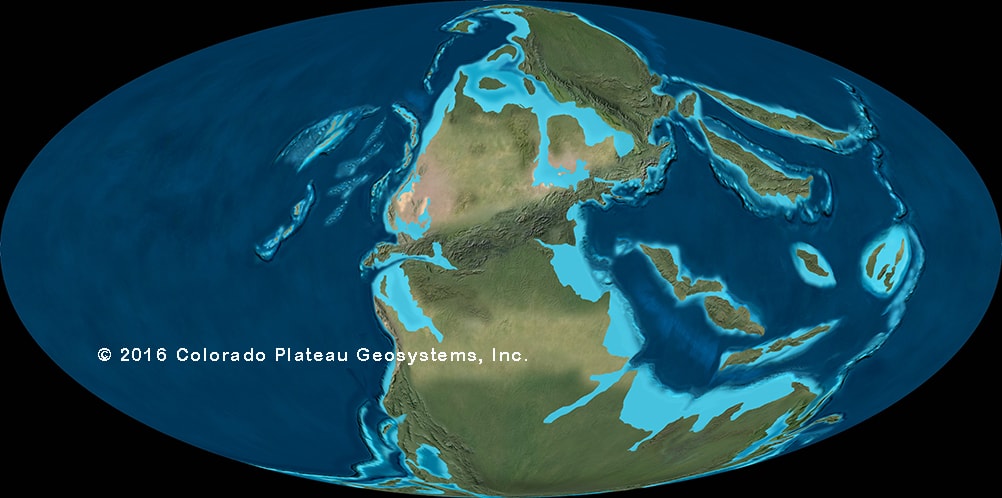
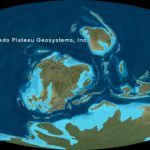
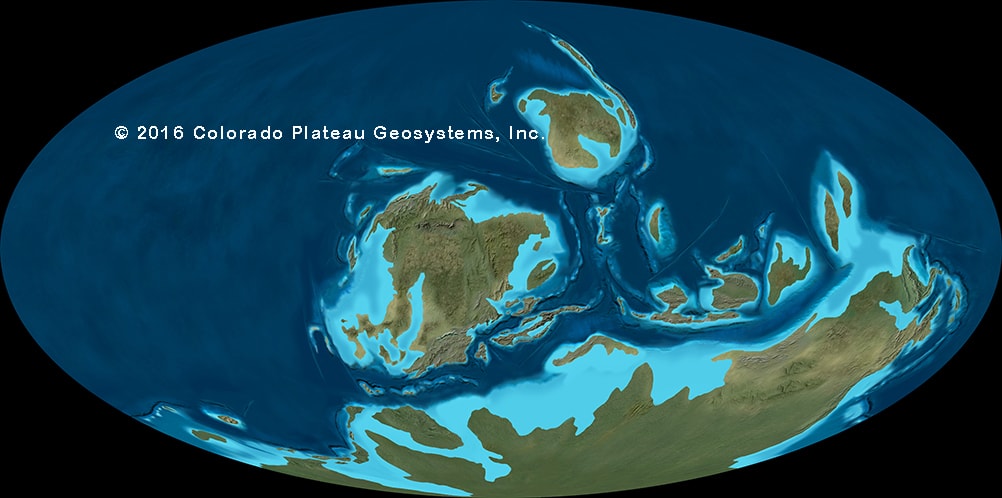
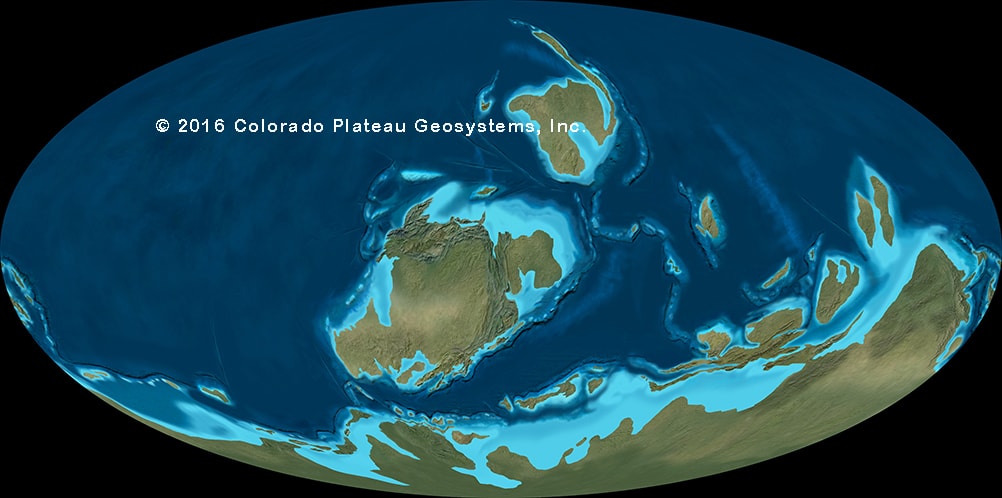
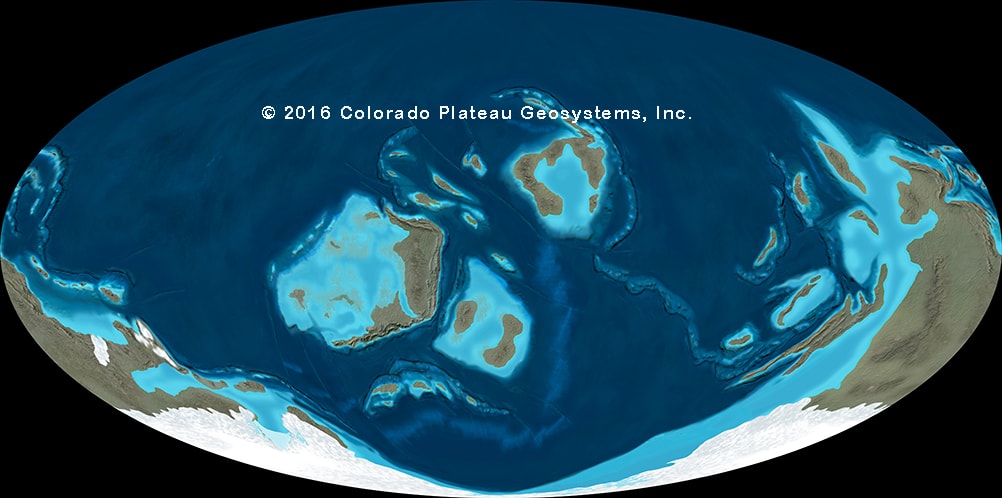
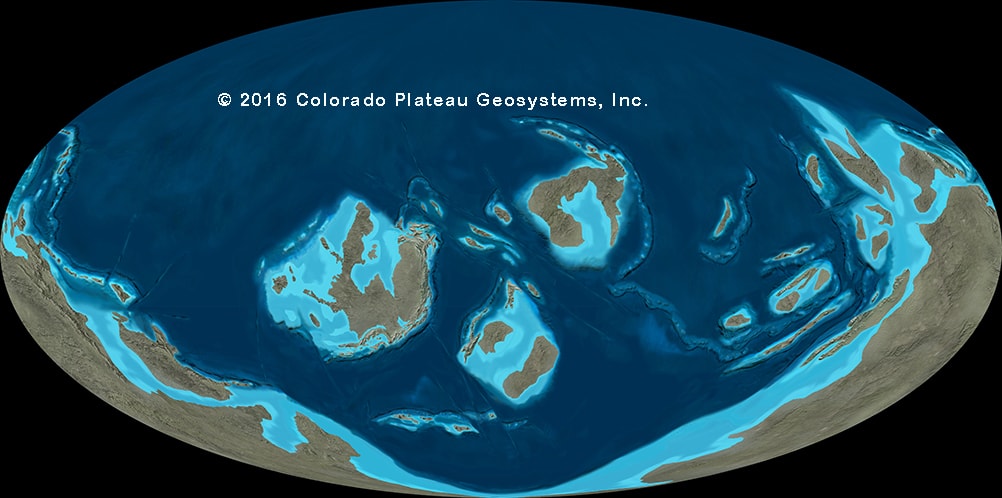
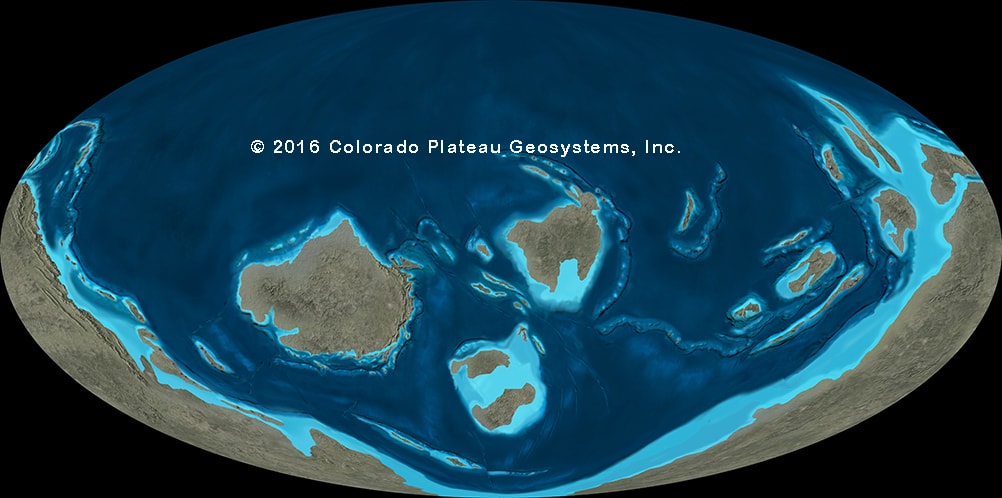
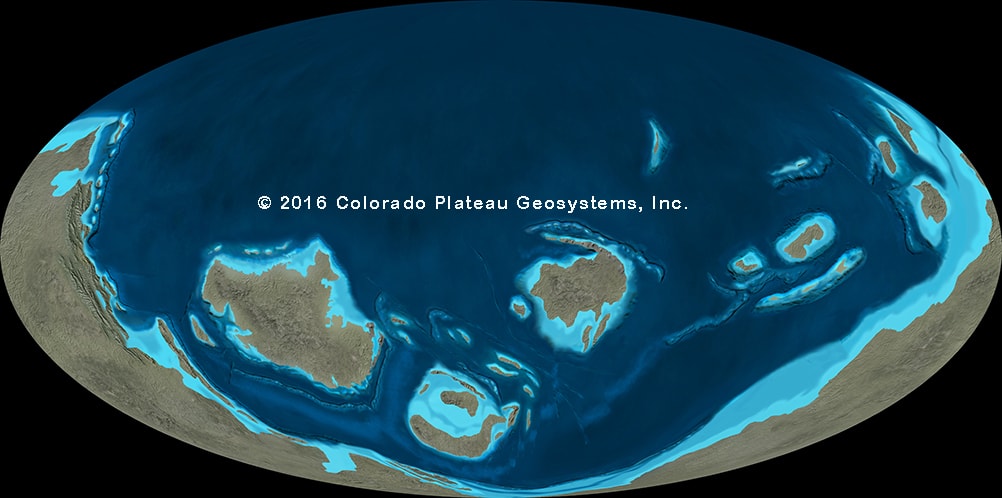
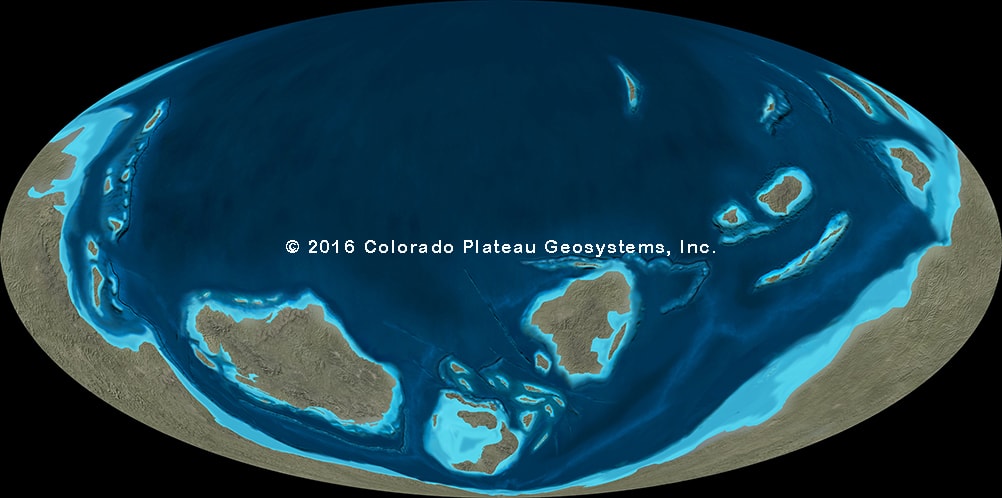
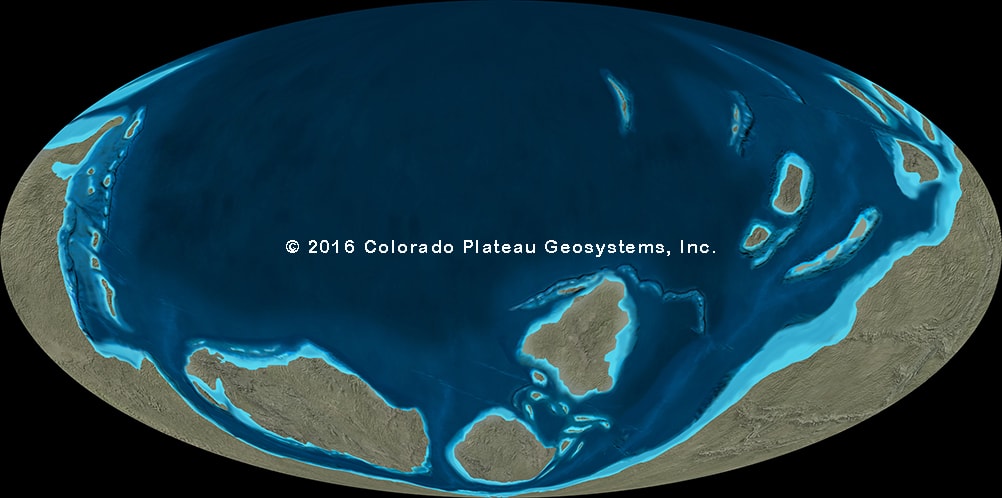
The Global Paleogeography and Tectonics in Deep Time series was completed in early 2016. The maps were completely redone using latest data and information on plate-tectonic Earth history. The global views presented in this series illustrate how the Earth may have appeared through deep geologic time. Because Earth paleogeography becomes increasingly controversial and difficult to decipher with increasing time, a maximum time slice of 600 Ma (mega annum = millions of years before present) was selected. This interval, which is latest Neoproterozoic, occurred during the break-up of the supercontinent Rodinia and the formation of the major continents of Gondwana, Baltica, Laurentia, and Siberia. The last 600 m. yrs. reflects 1½ continental supercycles – the break-up of Rodinia, formation of Pangaea, break-up of Pangaea, and initiation of new supercontinent in Northern Hemisphere, so far composed of Europe, Asia, and North America.
The graphic data for the global paleogeography were plotted on a rectangular projection 3000 x 6000 pixels. Because of the extreme distortion of this projection N and S of 60°, orthographic projections of the poles were used to assist in terrane placement and painting of the map features. In many cases, several projection changes (orthographic to equirectangular and equirectangular to orthographic) were necessary.
The positions of the major continental blocks through time were established from plate-tectonic models presented in the geologic literature (see references). Many regional papers from the literature were used to provide details and to aid in tracing the history of the numerous micro-continents, arcs, and other tectonic elements. The time slices are mostly 10 m. yrs. apart and therefore are averages of what the Earth may have looked like for the given time slice. This is especially true of paleo-shorelines that should be considered approximations; shorelines change much more rapidly than plate positions. A subtle change in plate position over 10 m.yrs. may have had 5-10 major changes of shoreline position. Therefore each of the time slices should be viewed as representing paleogeography over +/- 2 or 3 m.yrs. relative to the absolute age given on the time slice. Some of the early Paleozoic reconstructions likely have increased +/- values. The time scale used is from Ogg, et al., 2008 (with corrections in 2012).
Maps are rasterized pixel images and are not shape files (nor are they based on shape files). Paleogeographic and paleotectonic elements (thrust belts, volcanic centers, paleo-shorelines, dune fields, basin geometry, facies maps, etc.) are plotted from the geologic literature and redrawn, repositioned, or reprojected on the base maps for the given time slices. This information is then used to construct the paleogeography. Paleogeography is cloned or painted using Photoshop®; cloned images are mostly from GeoMapApp, a marine geoscience, global topography data system (http://www.geomapapp.org/); cloned modern Earth DEM images from GeoMapApp are selected as modern analogues to the paleo-features they are chosen to represent; most DEM images have been re-colored, resized, and/or re-shaped in Photoshop® to fit the known or inferred geometry of the ancient features. Paleoclimate patterns, shown via hues of greens vs browns and tans, are generalized; pre-Siluro-Devonian maps (600 Ma to 400 Ma) are uniformly drab, reflecting lack of significant continental vegetation.
The continent/country/shoreline/plate-outline lines serve as an aid in tracing major continental blocks through geologic time. Many of these blocks have been significantly reshaped by tectonic processes through time so the shapes shown at various time slices may be only approximations of true geometry of a given element at a given time. The maps may be displayed with or without these outlines as well as the latitude-longitude lines.
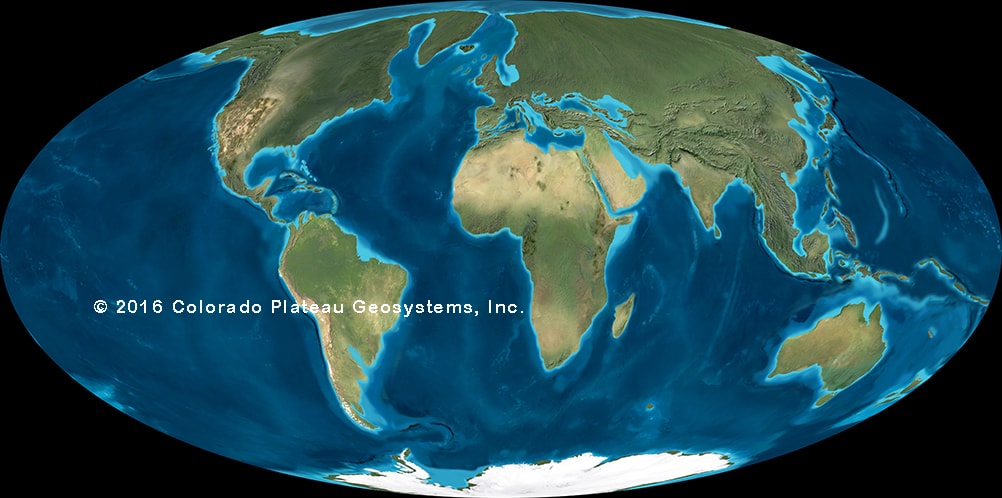
Cenozoic Era
-
- Cenozoic: ~00 Ma Moll_present-geomap
-
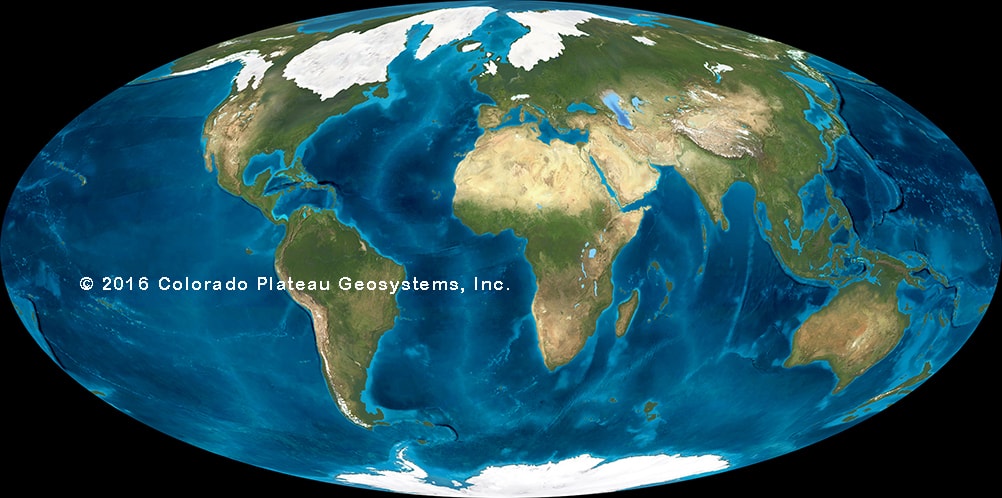
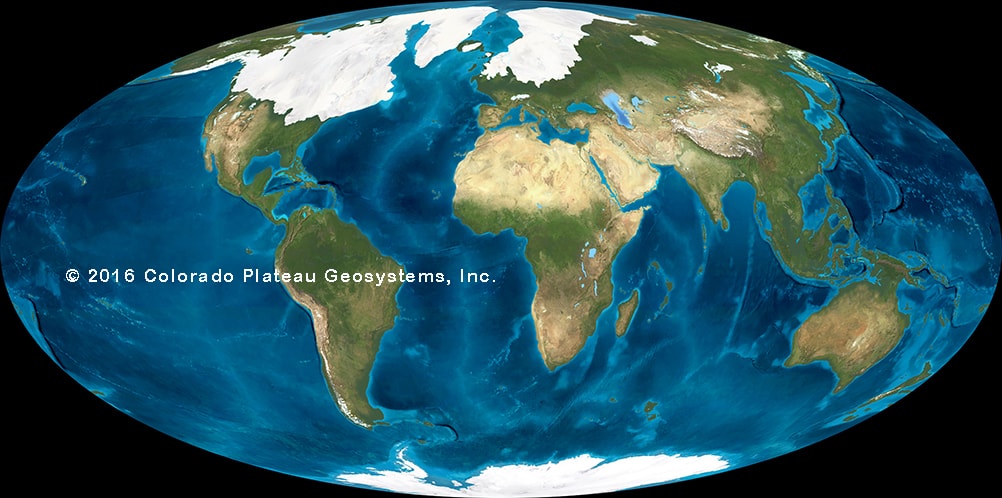
- Cenozoic: ~10 Ka Moll_pleist-Holo
-

- Cenozoic: ~21 Ka Moll_pleist-Wisc-MaxGlac

-
- Cenozoic: ~120 Ka Moll-Interglacial

-
- Cenozoic: ~144 Ka Moll_pleist Ill_MaxGlac
-
- Cenozoic: ~220 Ka moll_pleist advance
-
- Cenozoic: ~322 Ka Moll-Interglacial
-
- Cenozoic: ~566 Ka Moll_pleist advance
-
- Cenozoic: ~610 Ka Moll-Interglacial
-
- Cenozoic: 1 Ma Moll_pleist
-
- Cenozoic: 2 Ma Moll_pleist
-

- Cenozoic: 4 Ma Moll _Neo-Plio
-
- Cenozoic: 5 Ma Moll _Neo-Plio
-
- Cenozoic: 10 Ma Moll _Neo-Mio
-

- Cenozoic: 20 Ma Moll Neo_Mio
-
- Cenozoic: 30 Ma Moll Paleo_Olig

-
- Cenozoic: 40 Ma Moll_Paleo_Eoc
-
- Cenozoic: 50 Ma Moll Paleo_Eocene
-
- Cenozoic: 60 Ma Moll_Paleo-Pal
-
- Cenozoic: 65 Ma Moll _K-T
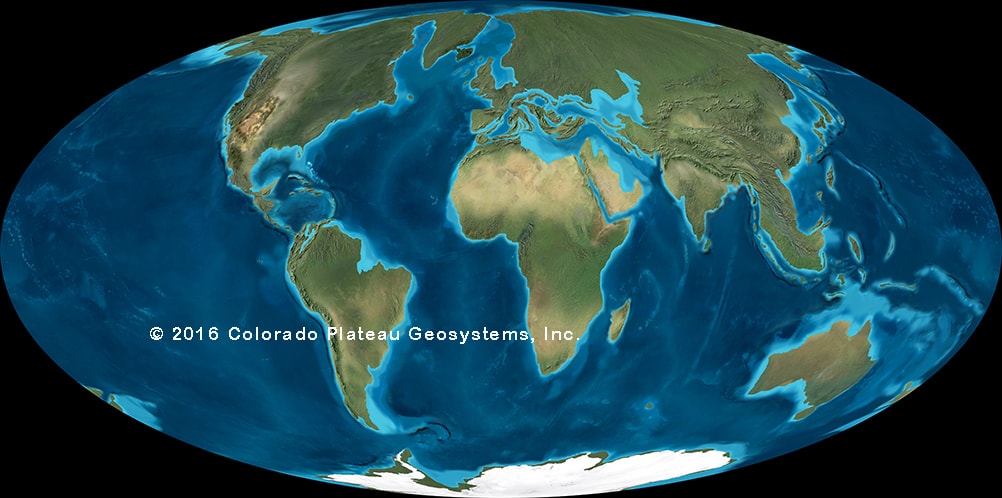
Mesozoic Era
-
- Mesozoic: 70 Ma Moll _Late-Cret
-
- Mesozoic: 80 Ma Moll_Late-Cret
-
- Mesozoic: 90 Ma Moll-Cret
-
- Mesozoic: 100 Ma Moll Mid-Cret
-
- Mesozoic: 110 Ma Moll _E-Cret
-
- Mesozoic: 120 Ma Moll_E-Cret
-
- Mesozoic: 130 Ma Moll _E-Cret
-
- Mesozoic: 140 Ma Moll_E-Cret
-
- Mesozoic: 150 Ma Moll _Jur
-
- Mesozoic: 160 Ma Moll_Jur
-
- Mesozoic: 170 Ma Moll _Jur
-
- Mesozoic: 180 Ma Moll_Jur
-
- Mesozoic: 190 Ma Moll
-
- Mesozoic: 200 ma Moll_Jur
-
- Mesozoic: 220 Ma Moll-Triassic
-
- Mesozoic: 240 Ma Moll_Tri
-
- Mesozoic: 250 Ma Moll_PTr
Paleozoic Era
-
- Paleozoic: 260 Ma Moll-Permian
-
- Paleozoic: 280 Ma Moll_Perm

-
- Paleozoic: 300 Ma Moll_Penn
-
- Paleozoic: 320 Ma Moll_M-Pp
-
- Paleozoic: 340 Ma Moll_Miss
-
- Paleozoic: 350 Ma Moll_Miss
-
- Paleozoic: 360 Ma Moll_Dev
-
- Paleozoic: 370 Ma Moll_Dev
-
- Paleozoic: 380 Ma Moll_Dev
-
- Paleozoic: 400 Ma Moll_Dev
-
- Paleozoic: 420 Ma Moll_Sil
-
- Paleozoic: 440 Ma Moll_Sil

-
- Paleozoic: 450 Ma Moll_Ord
-
- Paleozoic: 460 Ma Moll_Ord
-
- Paleozoic: 480 Ma Moll_Ord
-
- Paleozoic: 500 ma Moll_Cambrian
-
- Paleozoic: 520 Ma Moll Camb
-
- Paleozoic: 540 Ma Moll_Cambrian
-
- Paleozoic: 560 Ma Moll Late_Protero
-
- Paleozoic: 600 Ma Moll_Late_Proterozoic